Since the advent of solar PV systems in Australia in the early 2010s, there has been a growing number of installations of small residential as well as commercial, industrial and utility scale PV systems. However, as with any piece of equipment, the likelihood of component failure increases as the PV system ages, and solar maintenance is required. This is particularly relevant nowadays because PV modules have a typical lifetime of 25 years, whilst electronic components, such as inverters, may have a 10-year lifetime. Occurrence of component failure at some point within the system’s lifetime should be expected, particularly for older technology systems. This issue will be increasingly important in the future due to rising power bills and the falling price of PV modules both leading to anticipated exponential growth in number of PV installations in Australia. As of late 2019, 2.3m Australian homes are equipped with rooftop solar PV, equivalent to approximately 23.5% of Australian homes.
A system component failure can cause the system to perform below its designed system yield and reduce the savings generated compared to normal operation. It is thus essential to have an Operation and Maintenance (O&M) strategy to address this issue and ensure an optimum financial return within the system’s designed lifetime.
While an O&M schedule for residential systems is typically described in the system documentation provided to the owner, an effective O&M strategy for Utility Scale and Commercial and Industrial (C&I) Scale systems is critical to develop a strong business case. This is because these systems are much larger than residential ones and are designed to generate significant return on investment. C&I systems may also serve a specific business or functional purpose (i.e. carbon emission reduction targets, reduced reliance on the grid, coupling with a battery energy storage system for specific loads, etc.). Typically, there are three types of O&M strategies that can be applied to utility scale and C&I systems:
- Preventive Solar Maintenance – comprises regular scheduled inspections and servicing of equipment to prevent any unexpected downtime and unwanted production losses resulting from sudden failure of equipment. This is a High Maintenance Cost and Low System Loss Potential type of maintenance.
- Corrective Solar Maintenance – refers to unscheduled maintenance activities for addressing any equipment breakdowns after their occurrence and after they have been identified. This is a Low Maintenance Costs and High System Loss Potential type of maintenance.
- Condition Based Maintenance – employs real time data to prioritize and optimize maintenance and resources. This is a Low Maintenance Costs and Low System Loss Potential type of maintenance.
The best O&M strategy for C&I systems depends on the customer’s objective (i.e. minimise loss in system yield or minimise O&M spending) and the site circumstances (more information on this subject in GSES March 2020 article https://www.gses.com.au/pv-systems-operation-and-maintenance-options/). Condition Based Maintenance can be an attractive strategy for asset owners because it guarantees optimal system performance via remote and ongoing system performance surveillance and rapid detection of system performance reductions. While this approach also attracts minimal O&M spending, it does include an ongoing cost, because it involves a continuous and automated monitoring and system loss detection process, and possibly an upfront cost if the installation of monitoring hardware on site is required.
In essence, Condition Based Solar Maintenance enables rapid, data-informed O&M decisions; something that cannot be achieved with a scheduled O&M approach (Preventative Maintenance) or with a reactive O&M approach (Corrective Maintenance), which typically occurs after some period of time when the customer identifies a reduction in their savings (for example, when the customer is billed). Indeed, the service capability of Condition Based Maintenance relies on effective data collection and depends on the level of data enrichment applied. The resulting intelligence is used to detect system underperformance, diagnose potential issues on site and recommend O&M only if it serves the interest of the asset owner (see https://www.gses.com.au/pv-systems-operation-and-maintenance-options/ for this particular topic).
An End-to-end Condition Based Solar Maintenance Example
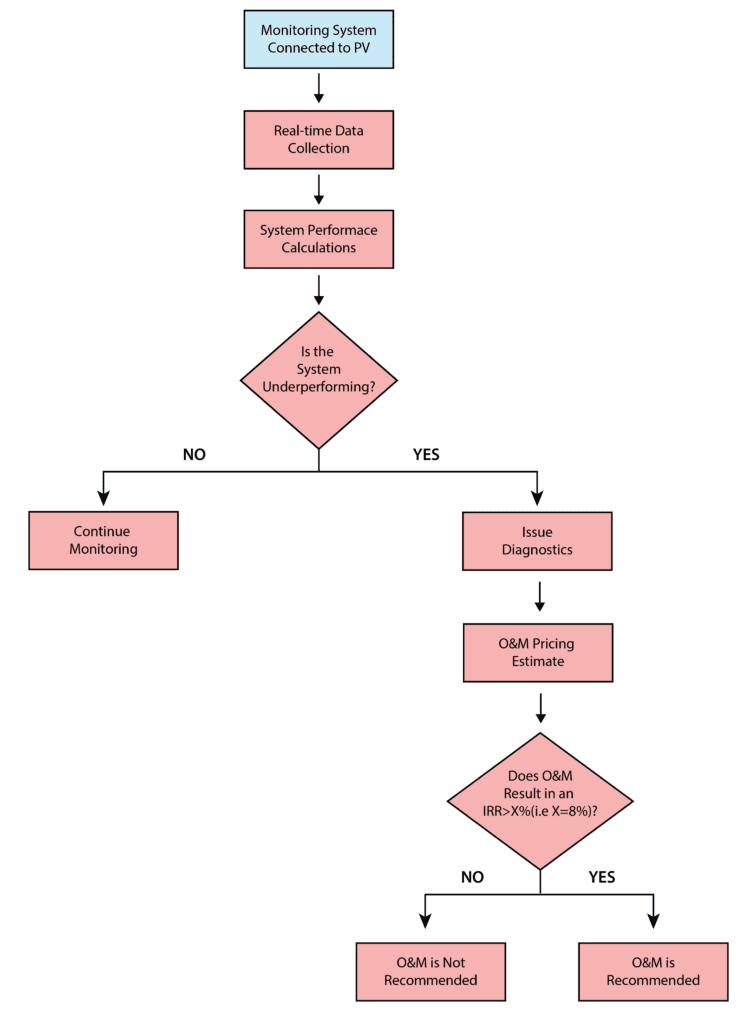
Real-time data acquisition and enrichment is front and centre in Condition Based Maintenance as it feeds into the ongoing system performance monitoring (Figure 1). It is therefore essential to establish uninterrupted PV system data acquisition for example by collecting the inverter data either directly (e.g. via an inverter portal data endpoint, if the manufacturer provides this feature) or indirectly by connecting a third-party monitoring hardware. Current transformer meters are a cheap alternative but they can only measure alternating current (AC) and cannot access direct current (DC) from the PV array or other inverter information which is crucial in the diagnostic phase.
Figure 1: Condition Based Maintenance Flowchart
Once an automatic data acquisition process is established, the data is fed into an algorithm that estimates system performance (Figure 1). A typical system performance metric is the Performance Ratio (PR), which is calculated as:
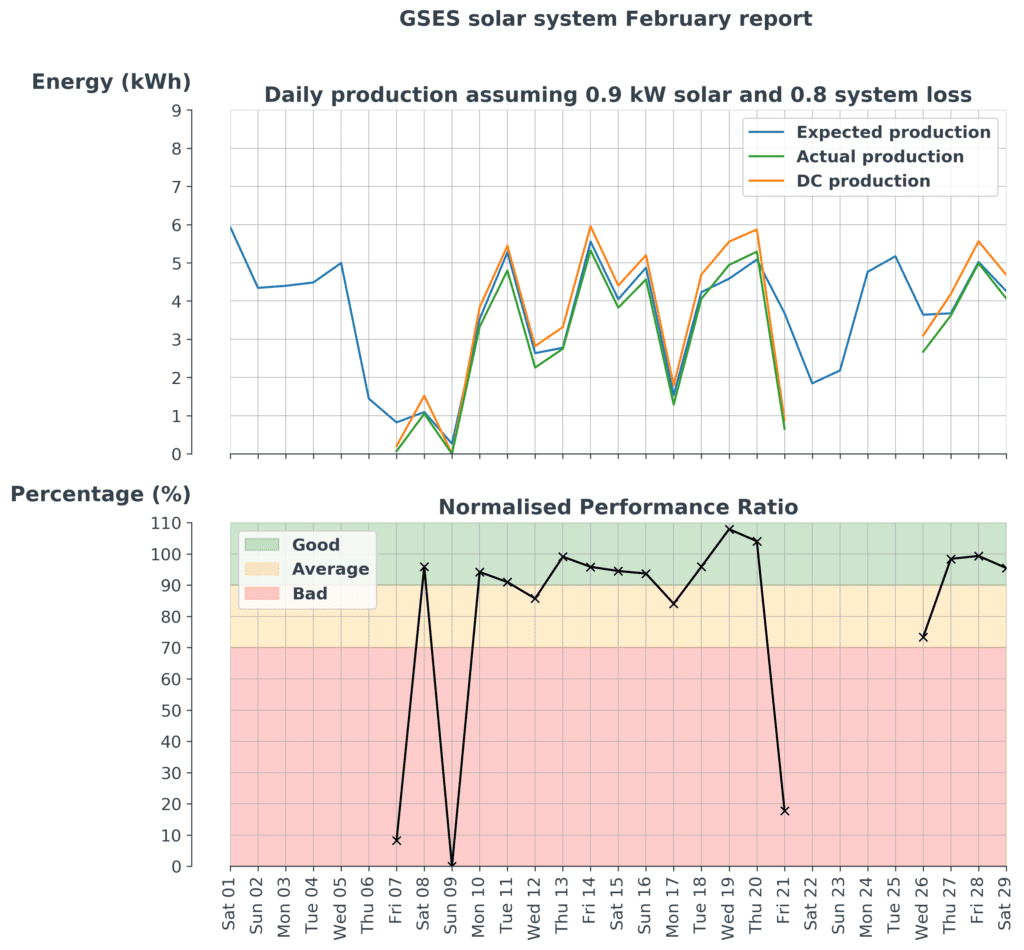
Where Emeasured is the measured energy generated by the PV system (kWh) and Etheoretical is the theoretical energy generation expected for the PV system (kWh). While Emeasured is calculated using the acquired power output data, Etheoretical is typically derived from solar irradiation which may be obtained from observational data from meteorological stations, in situ weather sensors or from modelled data from weather prediction models. For example, Figure 2 (top panel) shows the measured (green line) and theoretical energy (blue line) for a given PV system. The associated PR (bottom panel) here shows the system’s daily performance over a given month and reveals that, on some days, the system exhibited poor or average performances. Regardless of the method used, the performance metric has to provide reasonably frequent and realistic snapshots of system performance to enable rapid and accurate detection of performance loss.
Figure 2: Example of Daily Measured and Expected Energy Generation (kWh)
and associated Performance Ratio (%) for a given PV System.
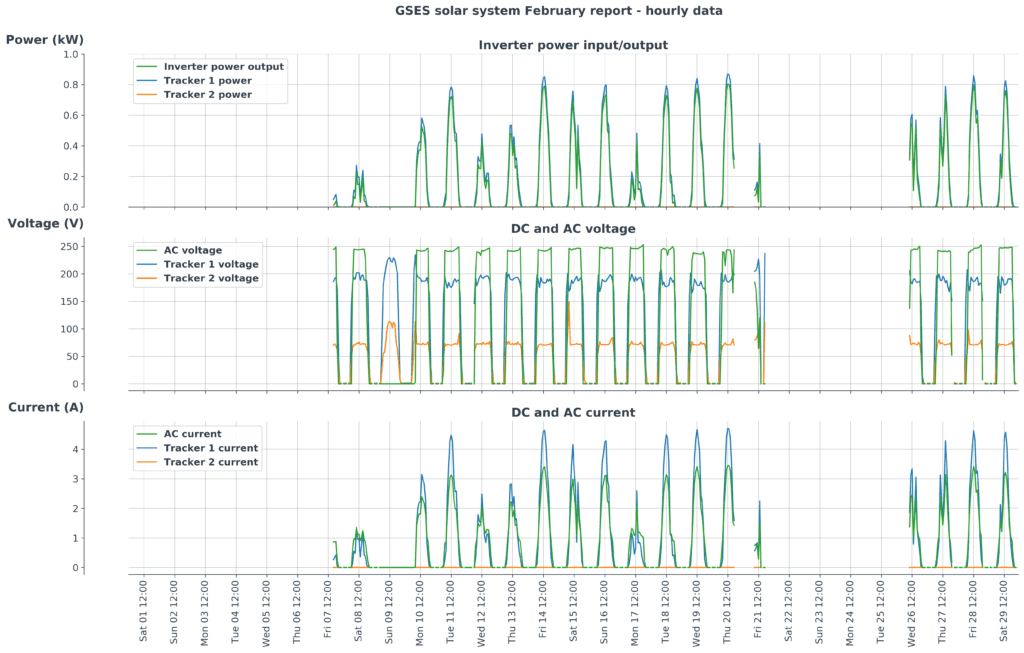
If the performance metric indicates a significant performance loss in comparison to what is expected from the PV system, then the system is further diagnosed using ancillary data. Such data may include PV string data, AC grid data from the inverter(s) and any additional available inverter information such as inverter error code, earth or grid faults, inverter temperature etc. For example, Figure 3 provides an hourly diagnostic of power, voltage and current on the DC side for each tracker as well as on the AC side.
Figure 3: Hourly DC and AC Power, Voltage and Current for the PV System from Figure 2
This diagnostic reveals that Friday 7th and Friday 21st were poorly performing days because the system was only operating over a part of the day as opposed to the expected full day operation. Sunday 9th was a poorly performing day (zero production) because there was no DC current and power input into the inverter on this day. It should be noted that the threshold for defining a robust performance loss should be carefully configured and refined based on assumptions relating to system loss (i.e natural module efficiency degradation over time, shading loss, temperature effects, etc.) and limitations of the method used for estimating theoretical energy generation.
Once the system diagnostics identified the potential issues at play, then a financial analysis for O&M can be considered (Figure 1). Consider the following simplified scenario (modified from https://www.gses.com.au/pv-systems-operation-and-maintenance-options/): a 10 kW system comprises 4 strings in parallel and exhibits a typical PR around 100%. At some point, the PR suddenly drops to 75% and does not recover over the next few days. Upon verifying that performance calculation assumptions cannot explain this sudden and unrecovered 25% drop, the system diagnostics identifies that one of the four strings in parallel has failed leaving only three strings operating. It is determined that to repair and reconnect this string, the labour and equipment cost will be $1200. The system has a 25-year nominal operation lifetime and saves the customer $2000/year when operating at 100% PR. Consider the asset owner requires an Internal Rate of Return (IRR) hurdle rate (i.e. the minimum acceptable rate of return) of 8%. If the system is in its second year of operation, the internal rate of return (IRR) is 42% and O&M is recommended and will be paid back after 2.4 years. If the system is in its twenty-third year of operation, then the IRR is -11% and O&M is not recommended since it will not be paid back within the system’s expected remaining lifetime. The O&M should of course go ahead if payback time is not important to the customer or if a security, compliance or safety issue is identified.
Condition Based Solar Maintenance Value Comparison
In this context, Condition Based Solar Maintenance is therefore a similar strategy to Corrective Maintenance as they are both reactive measures. What sets Condition Based Maintenance apart however is the real-time monitoring, rapid underperformance detection and alerting process and the timely O&M recommendations in the interest of the asset owner. It is a data-driven decision process which minimises savings loss caused by systems underperforming over prolonged period of time. This goes a step further from smart monitoring platforms and inverter data portals, which can only provide ongoing monitoring and may feature underperformance detection and alerting.
In many instances, the owner is not aware that the PV system is underperforming until they identify a savings loss in their bill. For example, consider the previous 25% drop scenario. It may be difficult to identify a 25% savings loss on a power bill for a 10-kW system, even when the bill is compared to previous years. This is because the owner may think the higher bill is attributed to variability from change in consumptions habits, unusual weather conditions, change in grid tariffs, the system’s natural degradation overtime etc. Consider a scenario where the fault occurred on the second year and remained undetected throughout the system’s lifetime – this is equivalent to a $11,500 loss over 23 years.
GSES is currently developing a centralised PV system ongoing monitoring portal and a Condition Based Maintenance consultancy service. Get in touch at info@gses.com.au if you would like to learn more about this service.
