
Introduction
In this article, we will be comparing the two most widely used and industry standard photovoltaic simulation software packages in the Australian solar industry, PVsyst vs. Helioscope. The increased requirement for system modelling has seen the rise of simulation tools such as PVSyst, Helioscope, System Advisory Model (SAM), HOMER Pro and packages delivered by Aurora Solar. The list is extensive for both free and licensed software packages.
The article will aim to compare the following:
- Bankability of the software;
- Similarities and differences between software packages; and
- The benefits and motivations for using each software package.
Background
The success of any solar project depends upon knowing the amount of energy the system will generate. The system generation has a significant effect upon:
- The financial benefit of a PV system throughout its lifetime, as profitability is determined through the calculation of accurate energy performance and hence financial impacts;
- The energy guarantees of the PV system;
- The ability to meet the terms and conditions of power purchase agreements (PPAs) which are signed on the basis of energy production guarantees; and
- The ability to meet the requirements of Distributed Network Service Providers (DNSPs), as they may need to know the amount of energy that is being injected into the electricity grid.
It is therefore essential that solar designers produce energy production estimates that accurately predict real time production. Software-based solar simulation tools are effective means of modelling PV systems, to assess the energy production both instantaneously and cumulatively over the lifetime of the project.
PVsyst Solar Simulation Software
PVSyst is a well-established solar simulation software package that is renowned throughout the industry. The software was developed in Switzerland and has undergone and continues to undergo updates and improvements as the industry develops. It is a Windows based software package designed for the study, sizing and data analysis of PV systems ranging from residential scale to utility scale. The software has the functionality to simulate grid connected, stand-alone, water pumping and DC-grid PV systems, it also has an extensive Meteonorm satellite database, PV System components databases, as well as general solar energy tools.
The software is used by professionals such as architects, engineers and researchers, it assists in analysing and evaluating where a solar system can be installed in a given site and what objects or parameters can impact the energy production of the system. PVSyst can be purchased in full at once and provides yearly licence updates, with a 1-month free trial option as well.
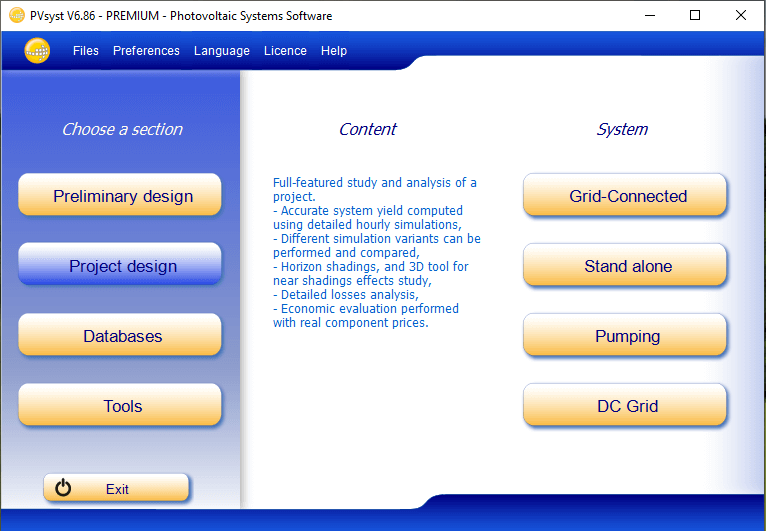
Figure 1: The project menu of PVSyst, showing its full project design functionality for each system type
The solar simulation software offers 3 levels of PV System study, roughly corresponding to the different stages in the development of a real project (Figure 1), these stages are as follows:
Preliminary Design:
This is the pre-sizing step of a project.In this mode the system yield evaluations are performed very quickly in monthly values, using only primary system characteristics and parameters, without specifying actual system components. A rough estimation of the system cost is also available. For grid connected systems, and especially for building integration, this level is suited for those with limited solar knowledge. The preliminary design inputs include information on available area, PV technology (e.g. polycrystalline/monocrystalline or thin film Solar cells), power required or desired investment.
For stand-alone systems this tool sizes the required PV power, battery capacity and generator, given the load profile and the “Loss of the load” (LOL) probability i.e. the amount of the energy that cannot be supplied to the user). For pumping systems, given water requirements and a depth (overall head) for pumping and specifying some general technical options, this tool evaluates the pump power and PV array size needed. As for stand-alone systems, this sizing may be performed according to a specific probability that the water needs are not met over the year.
Project Design:
This section is where the designer performs a thorough system design using detailed input parameters and hourly simulation data. Within the framework of a “project”, the user can perform different simulation variants and compare them. The user has to define the module (plane) orientation (with the possibility of tracking planes or shed (staggered tables) mounting), and to choose the specific system components. The software guides the user through the steps of designing the PV system, from choosing the modules, inverter, shading analysis, loss estimation to simulating the behaviour of batteries and pumps.
As part of this process the user can also specify more detailed parameters and analyse fine effects such as thermal behaviour, wiring, module quality, mismatch and incidence angle losses, horizon (far shading) (Figure 2), or partial shading of near objects on the array (Figure 3). The results in this section of the software include many design simulation variables, which are displayed in monthly, daily or hourly values, and can even be transferred to other software for further analysis. The “Loss Diagram” at the end of the simulation is very useful for identifying the weaknesses of the system design.
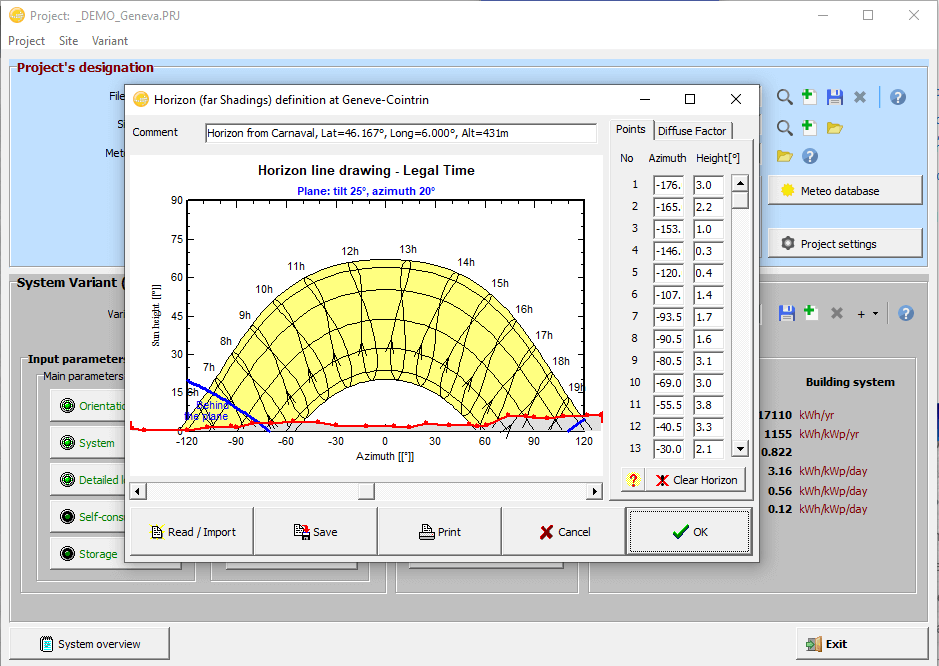
Figure 2: Determining the far field shadings on the horizon that can impact a system in PVSyst
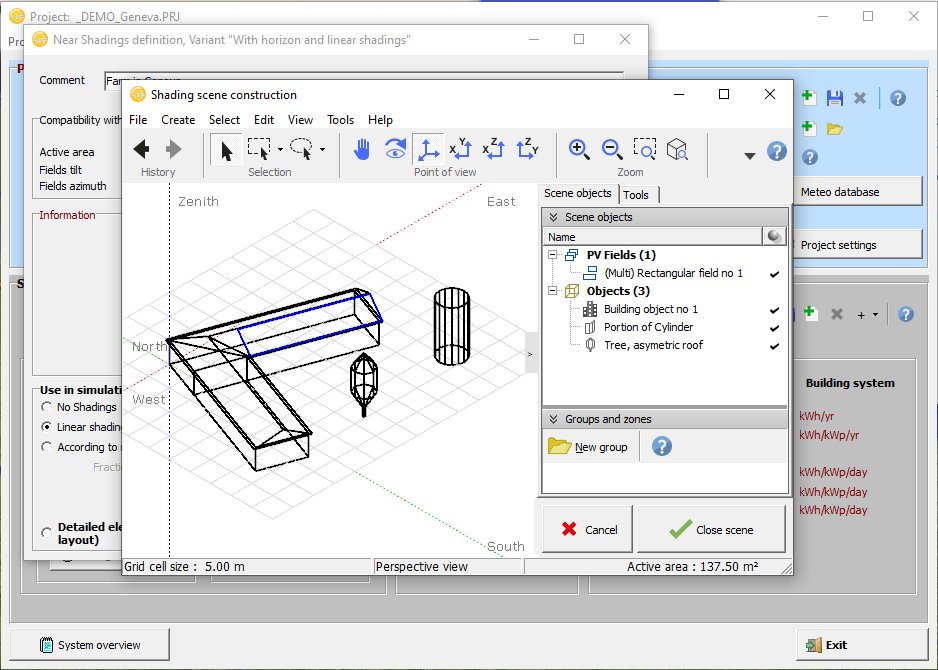
Figure 3: Constructing a near field shading scene to determine the shading from nearby objects on the PV system in PVSyst
- Databases and Tools:The database management system of the software is very sound and can be fine tuned as per user needs. The database includes meteorological data and PV components such as up to date modules, inverters and optimisers. The user is also able to create custom geographical files by either modifying the existing ones in the software or by manually importing meteorological data from several predefined sources (or ASCII files). The tools such as optimization tool and measured data analysis allows the user to compare different simulation variants. The measured data analysis tool allows to download system related data in the forms of tables and graphs to minutely analyse small irregularities in the parameters of the system. The software contains some specific tools useful when dealing with solar energy systems such as table and graphs of Meteonorm data or solar geometry parameters, irradiation under a clear day model, PV-array behaviour under partial shadings or module mismatch.
Sounds pretty good right? You can start learning PVsyst with their free software trial and our online course today!
Helioscope Solar Simulation Software
Helioscope solar simulation software is a web-based tool developed by Folsom Labs, it provides all the features which are available in PVSyst along with AutoCAD functionality. However, unlike PVSyst, this software package only has the capabilities of developing and simulating grid-connected PV systems.
Being a web-based tool, the program does not require a sophisticated computer to operate. The software comes with a monthly or annual subscription fee and does not require the user to purchase it (as in the case of PVSyst), this allows the user to start and stop the software service anytime. Helioscope is a fairly intuitive program where the user can easily choose from location’s address, select the roof area for the array, specify the type of PV modules, inverter and combiner box positioning details.
Helioscope also uses Google Earth to find the location of the site, which allows the user to produce a 3D model based on the site characteristics (Figure 4). It also has more intuitive capabilities of conducting shading studies of the site based on the generated 3D model (Figure 5). Helioscope is also a beneficial software to use, as it has the capability of directly exporting the 3D models generated to 3D modelling software packages such as SketchUp for further analysis such as shadow analysis or incorporating location terrains for geotechnical analysis.
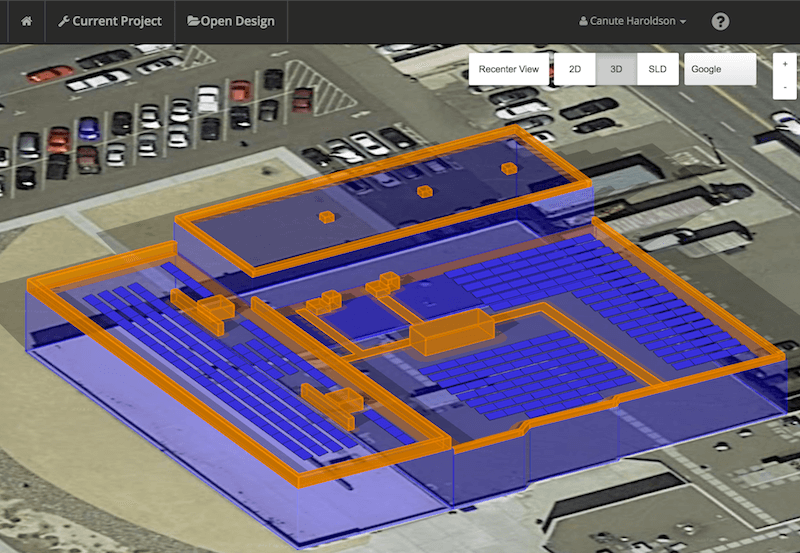
Figure 4: Developing the 3D model of a site in Helioscope
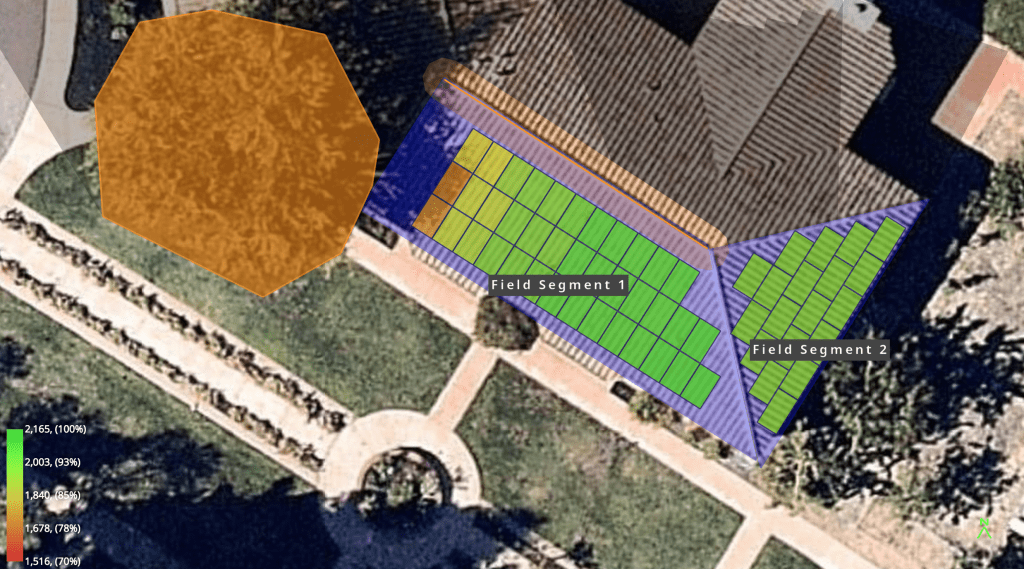
Figure 5: Helioscope’s intuitive shade reporting tool showing the impact of shading on a system
In addition to autogenerating a PV layout, Helioscope provides a detailed wiring diagram, including the exact placement of modules, inverters and other equipment. The software uses the same state of art-mathematical models that are executed in a similar fashion to PVSyst, however it excels by conducting simulations on a module level, in comparison to PVSyst which simulates on a string/sub-array level. As a result, Helioscope has the ability to generate a precise estimation of energy production due to its ability to simulate at a granular scale. However, as the functionality of the product is limited to grid connected systems, it does not have the flexibility to model for a variety of other system types such as stand-alone and hybrid systems.
Listed below are the sections how Helioscope is structured:
Creating Project:
This section allows the user to select the desired location for solar installation by using GPS coordinates, ZIP codes, or address.
Design
Here the software allows the user to plan out the PV array layout on the type of site selected in the “creating project” stage. This stage can be used to make multiple clones of the design to compare different design alternatives. With the layout, the design section also includes electrical design which includes wiring configuration and inverter type. Each design created will show a brief bill of materials including the module quantity, cable quantity, string type and combiner boxes.
Mechanical
A mechanical layout is dependent on the field segments defining the area occupied with the solar array, this allows the user to select zones and near field objects as such as trees and other shading structures to be modelled and assess the impact on the array layout. For a rooftop solar array, objects can be defined in this section, such as adjusting the length, width and heights of near shading objects. The tool allows the user to select an option to keep the array out of shading from roof objects (Figure 6). Drawing walkways is also a feature in this section.
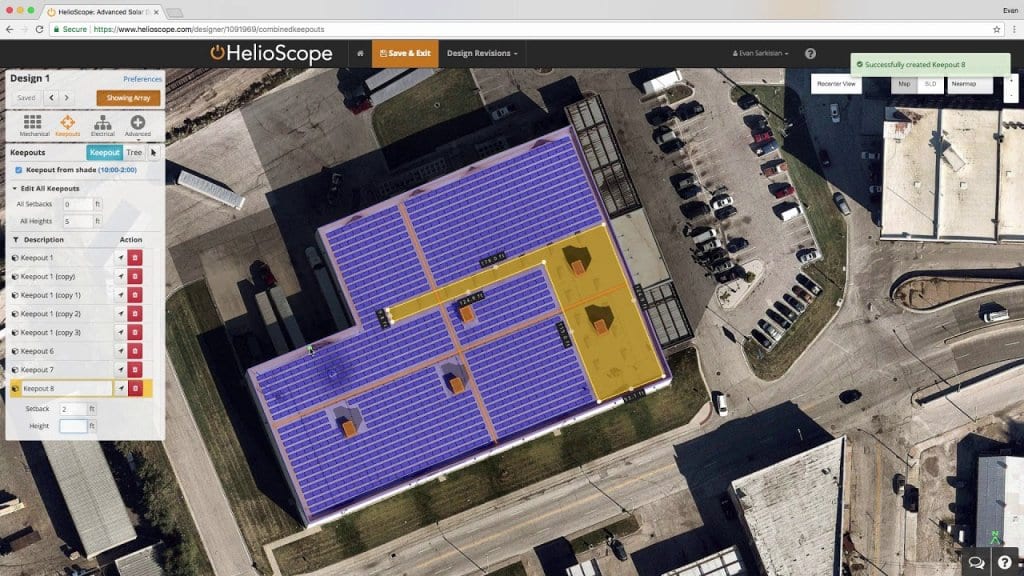
Figure 6: Assigning “keep out” zones to ensure that the array is not positioned in areas that can be
shaded by surrounding roof objects in Helioscope
- Electrical:The electrical design complements the mechanical layout by generating module stringing and connecting each to an inverter (Figure 7). The user can choose the inverter model, adjust DC/AC ratios, automatically carry out stringing of the whole site, place and modify combiner box locations and select optimiser string configuration if required. Moreover, the section also represents the percentage value of voltage drop next to the conductors at Standard Test Conditions. The user can define the size of conductors (DC subarray circuits) as well. More detailed information can be viewed in the SLD (Single Line Diagram) tab of tool which generates a quick, high level electrical SLD for understanding cable reticulation and configuration of the system.
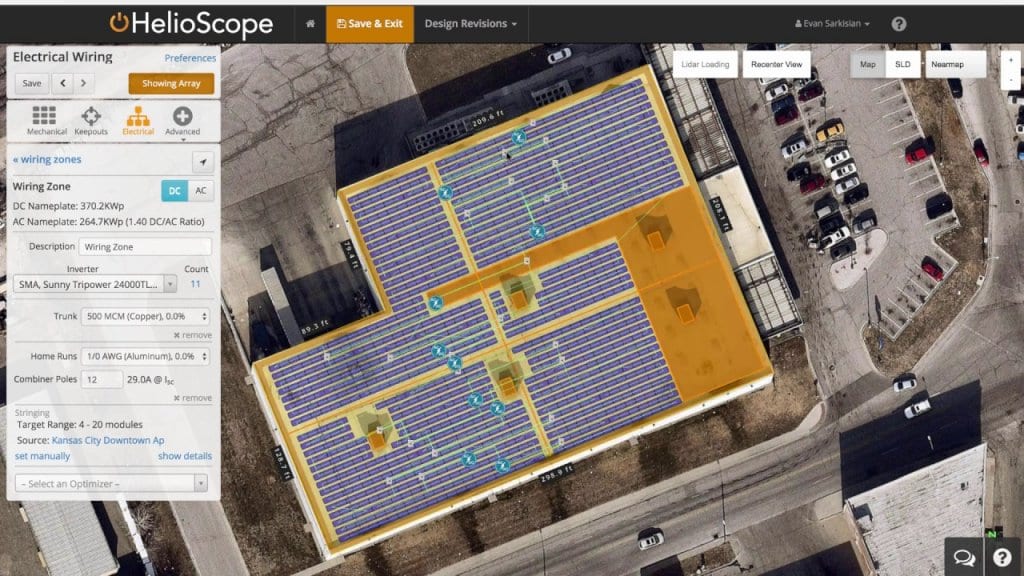
Figure 7: Carrying out electrical design in Helioscope
- Reports:After completing the above mentioned steps, the user can finally generate an energy production report which will show system metrics such as; monthly energy production for the year, sources of system loss, annual production, condition settings (meteorological files and type of transposition model used), components, wiring zones, field segments, and detailed layout (which is also downloadable as image). The results can then be exported into CSV file for further analysis or transfer.
Comparison between PVsyst and Helioscope Solar Simulation Software
The following table highlights the most significant differences between PVSyst and Helioscope:
| PVSyst | Helioscope |
| Oldest most renowned simulation software used in the industry. | Recently developed solar tool for simulations. |
| Downloadable software. | Web-based software tool. |
| Oriented towards research and project developers. | Oriented for engineering practitioners. |
| Fairly customizable and used for detailed analysis. | Less customizable but provides medium level of analysis compared to PVSyst. |
| Optimisation tools are very efficient and prompt in calculation. | In order to carry out optimisation the user has to create multi designs and separately compare them by exporting all results in CSV format. |
| Allows simulations of stand-alone, hybrid and pumping systems. | Limited to only grid connected systems. |
| Meteonorm files are more customizable as per user needs. | Does not provide as much flexibility of Meteonorm file customizations as per user needs. Possible but more laborious when compared to PVSyst. |
| Different data sources are available on the Meteonorm database within the software. | Limited Meteonorm database sources available. Any other source needs to imported manually. |
| Horizon profiles can be automatically generated using different horizon tool options | Horizon profiles have to manually imported |
| Shading analysis carried out using beam irradiance data from the weather file to generate shading profiles. | Uses plugin from Google SketchUp to generate shading profiles. |
| Carries out shading analysis at string level. | Carries out shading analysis at module level. |
| Uses industry standard solar radiation calculations. | Uses industry standard solar radiation calculations. |
| Aggregates losses for system calculations as calculations are carried out on string level. However, fine tuning can be carried out within the software. | Provides better system level calculations (e.g. mismatch, wire losses, etc.) as the simulations are carried out on a module level. |
| Allows greater customizability with thermal parameters of modules. References of thermal values listed in the help section, for different types of installation. | Thermal parameters can be edited, but limited references provided within the software to understand the magnitude of the values entered. |
| Ageing and degradation simulations can be carried out within the software. | Does not have ageing and degradation simulations. |
| More customization options while carrying out simulations. | Does not provide customisation but offers a greater level of granularity while carrying out simulations. |
| System design does not have a limit. | System can only design a maximum of 5MW in one design. |
| Despite large system models, the software runs smoothly without any crashes or bugs. | The web-based tool can be slowed down when trying to model system above 50MW as system will be split up into separate 5MW sites, this can result in crashes, and errors while exporting files. |
| Allow importing 3D models for near field shading analysis. | Does not allow importing 3D models. Only Export is permitted. |
| Near Field Shading modelling is not as intuitive and user friendly. | Near Field Shading drawing such as keep out zones, obstructions and walkways can be drawn very easily without much know how of the tool. |
| PV components such as modules and inverters are up to date without any errors. | PV components are sometimes not correctly upload with fair difference in latest odule files (.PAN) and Inverter files (.OND). |
| Can provide detail simulations for Bifacial modules. | Limited scope for simulating Bifacial modules. |
| .PAN and .OND Files can be modified as per user needs within the software. | .PAN and .OND Files cannot be modified in the software. |
| Allows for power factor settings and export control settings. | User cannot control or adjust these parameters. |
| P50-P90 estimates can be easily carried out within the software. | In order to do P50-P90 estimates, the user needs to create datasets manually and carry out a statistical analysis, which can be time consuming. |
| Exporting customized graphs and data possible. | The user has to individually download graphs and plot against the desired parameter in order to compare results. |
| Robust and in-depth process of carrying out the energy production analysis. | Energy production analysis can be carried out fairly quickly and can provide good amount of data for the site. |
| Allows for detailed economic analysis of the system, automatically calculates IRR, payback periods etc. | Data needs to be exported and economic analysis can only be carried out externally which can be an additional time consuming process. |
| Typically used by solar designers and engineers. Not for sales professionals as the software requires an in-depth knowledge of engineering. | Typically used by solar designers, engineers and can have a flexibility to be used by sales professionals as the tool is fairly intuitive. |
Conclusion
PVSyst and Helioscope are both bankable solar energy simulation software which can provide the user with reliable production estimates. Each software has its advantages and disadvantages. PVSyst has been in the market for a longer period of time, it has become more developed allowing for very detailed and customizable simulations making it a preferred tool over Helioscope for design engineers. However with an increasing demand on the solar industry, there is an increased requirement for designers to develop simulations with a rapid turnaround time for a site analysis.
This is where Helioscope shines, it is fairly intuitive and can provide a production estimate close to +/-1% tolerance with a PVSyst Simulation when using the same meteorological files and PV system components (based on a study conducted by DNV GL). Therefore, it may be preferable to carrying out initial analysis in Helioscope and run a PVSyst simulation after the preliminary phase to validate the energy production results.
Software choice is ultimately governed by the requirements and capabilities of the user, project scope as well as wishes of the client – be it for training, research, project development or quick analysis purposes for a sale. The responsibility will ultimately fall on the designer to select the right software for the appropriate application, which can save time, cost and efforts for both the client and the engineer.
Next Steps
GSES has experienced users of PVSyst that can provide assistance to all designers and installers with their designs, be sure to contact the design team at design@mindaro.energy. Otherwise, our online short courses will bring you up to speed in some of these great pieces of solar simulation software.