Executive summary
As Solar PV systems become more mainstream and bankable, customers are pushing for performance security guarantees and this creates pressure on contractors to offer the best results. Unfortunately, this will mean someone will be financially affected if they take the estimate too far and the system cannot meet this target.
The following case study compares the system performance estimate for a 1.5 MWp PV System to the 2nd year of actual site generation data. GSES was contracted to complete the detailed system design of this ground mount system. The study involves a site whose energy generation is known for the 2018 year and is compared with the performance estimate created using the energy analysis tool (PVSyst). The simulation was completed using the average yearly irradiance from 1999 to 2018 from the Bureau of Meteorology (BOM) and includes performance loss estimates. This article will discuss the differences between the estimate and actual data and the major variables that lead to a balanced approach to ensure a satisfactory performance estimate that does not risk exposure.
Overview
The 1.5 MW ground mount system is located in rural Victoria. It utilises a mix of 330 W and 325 W Jinko Modules with Fronius ECO-27.0 kW inverters. Logged energy generation for 2018 is 2204 MWh. The GSES energy performance estimate predicted energy generation of 2035 MWh/yr based off the average yearly irradiance.
Assumptions
The following system losses/assumptions are related to energy modelling using PVSyst. These parameters have been compared to actual site data where available.
| Loss Parameters | Modelled | Actual |
| Thermal Losses | ||
| Uc (W/m2K) | 29 | Unavailable |
| Uv (W/m2K/m/s) | 0 | Unavailable |
| Ohmic Losses | ||
| DC ohmic Loss | 3% | 1.21% |
| AC ohmic Loss | 2% | 1.5% |
| Module Quality – LID – Mismatch | ||
| Module Efficiency Loss | -0.80% | -0.80% |
| Power Loss at MPP (Module Mismatch Loss) | 1% | Unavailable |
| LID loss factor | 2% | Unavailable |
| Power Loss at MPP (Strings voltage mismatch) | 0.10% | Unavailable |
| Yearly Soiling Loss Factor | 3% | Unavailable |
| IAM Losses | As per Module Definition | As per Module Definition |
| Auxiliaries losses | ||
| Auxiliaries during operation (day) (W/kW) | Include standard losses | Included in Generation |
| Night Auxiliaries losses (kW) | N/A | Unavailable |
| Ageing | N/A | N/A |
| Unavailability | 1.00% (3.6 days) | 1.36% – 5 days |
| Spectral Correction | – | – |
| Horizon or Far field Shading | From PVGIS | – |
| Loss Parameters | Modelled | Actual |
| Power Factor | 1 | 1 |
| Grid Power Limitation | Unlimited | 1500kVA |
| Annual variability | 4.60% | – |
Apart from modelling parameters, the synthetic weather file is assumed to have similar irradiation values on site. Synthetic irradiation values are generated by Meteonorm which is preinstalled in PVSyst. Meteonorm generates synthetic weather data to the exact coordinates of the site from a reference point (i.e. Historical measured data from the nearby weather station), details of how this is achieved is outside the scope of this article. For comparison, simulation with BOM weather station data (1.5 km from the site) was also carried out. The monthly irradiation values were taken from the BOM and entered in to PVSyst for energy modelling.
The difference in the average irradiation values between Meteonorm and BOM ground station data is plotted in Figure 1.
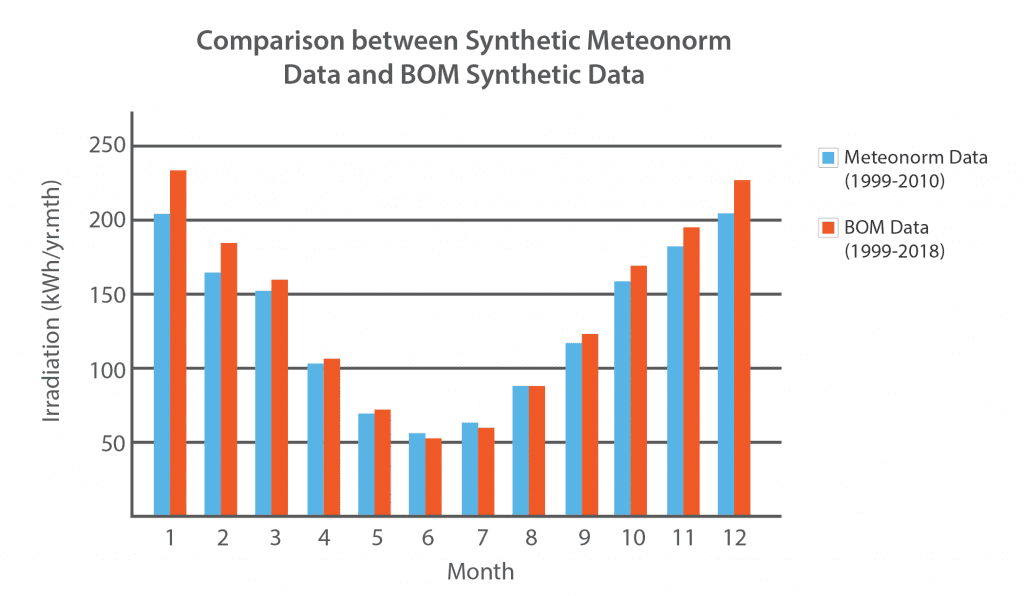
Figure 1: Comparison between Synthetic Meteonorm and BOM Satellite Derived Data
Given the proximity of the BOM weather station to the site we can assume that this will result in a more accurate result when estimating the system performance. Additionally, the Meteonorm data finishes at 2010 which leaves out the most recent 8 years of irradiation data.
Results
The table below shows an overall comparison in energy generation between modelled and actual site generation.
| Site Generation (Actual) | ||
| Energy Generation | 2204 MWh/year | |
| PVSyst (Modelled) | ||
| Meteonorm (1999-2010) | BOM (1999-2018) | |
| Energy Generation | 2035 MWh/year | 2088 MWh/year |
The table shows two different generation estimates using each of the weather files presented previously. From the final results we can conclude that the modelled analysis for energy generation is conservative relative to the actual site generation for the selected period, actual irradiation and temperature.
Detailed Discussion and Conclusions
By comparing the energy generation and the assumed and actual system losses we can look at the factors that contribute to the difference in energy generation:
- Average irradiance data
- Thermal Losses
- Ohmic Wiring Losses
- Unavailability Losses
- Light Induced Degradation (LID) Loss Factor
Let’s have a deeper look at following factors mentioned above.
Synthetic Weather File or Weather Data:
The weather file plays an important role as it is the core data required to carry out the simulation. In PVSyst there are different options of importing or generating weather files based on ground measured data.
The first simulation used Meteonorm synthetic weather generated data. All the data acquired was taken from the PVSyst’s Meteonorm directory. One limitation of this data is that, the actual reference data used to create the synthetic files is not known. The data is calculated based of surrounding ground stations and satellite data, but this exact method is not known. This could potentially mean that the Meteonorm irradiance data has been estimated and is incorrect.
Moreover, PVSyst only has Meteonorm weather data ranging from 1999-2010, this means that there might be years with inter annual variability that impacts on the average irradiation data that is used in the estimate.
The 2nd simulation was created using the BOM weather file. The irradiation values for Global Horizontal Irradiation (GHI) was imported into PVSyst and synthetic weather files were generated. The data collected was from the year 1999-2018 for simulation purpose, which is latest compared to the Meteonorm data in our previous variant.
In order to quantify the data from BOM we carried out data analysis to support our results. From BOM, we have 1990-2019 worth of data, out of which we are taking 1999-2018, i.e. 19 years of data. By plotting the normal distribution of the irradiation values, we can see where 2018 fits within the irradiation data set for yearly generation. A position to the right indicates a high irradiance year while a position to the left indicates a low irradiance year. The performance estimate from PVSyst is an average so by definition sits in the middle of the distribution.
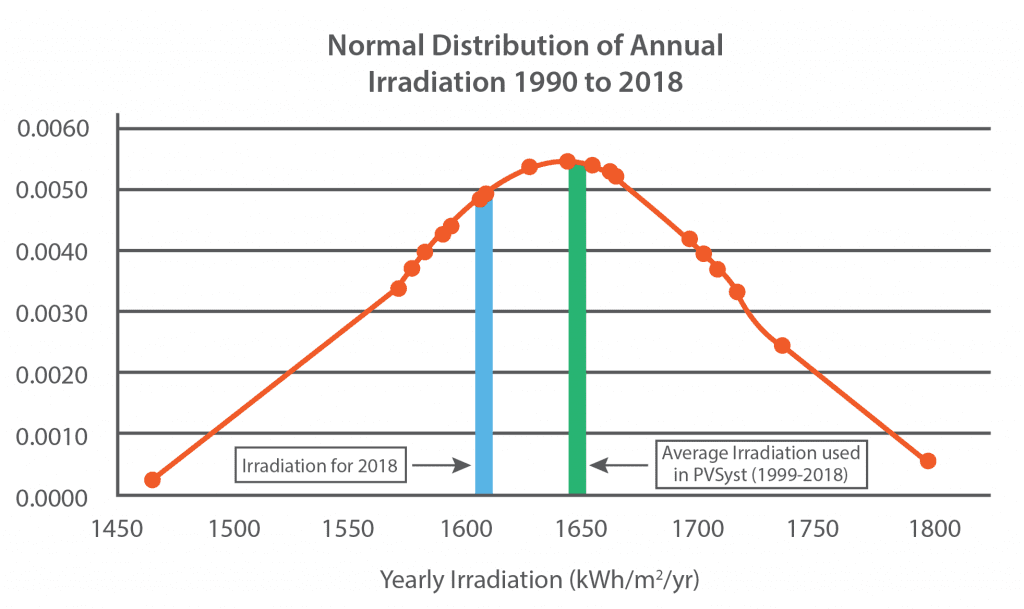
Figure 2: Normal Distribution of Annual Irradiation (1990-2018)
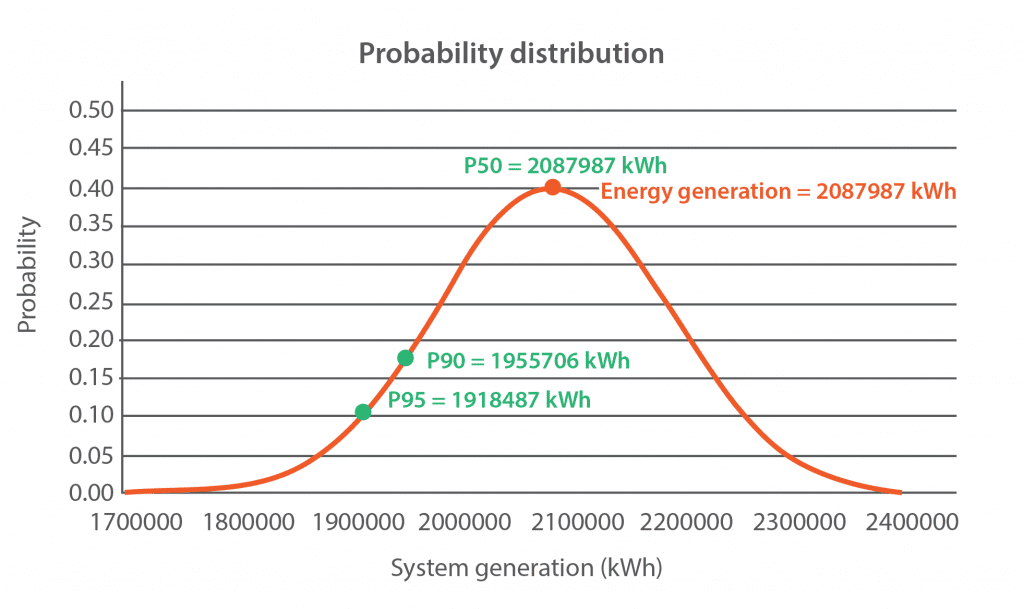
Figure 3: Probability distribution curve for annual PV generation
To quantify how conservative the performance estimate is compared to the energy generated we can measure where the 2018 year sits within the irradiation data set. Analysis indicates that 2018 is in the lower 38% of the data meaning that 62% of available years produce more irradiance. Statistically speaking, this places 2018 within one standard deviation (a Z Score of -0.4) of the average yearly irradiance. 2018 resulted in the generation of 2204 MWh, considering that 2018 was below average and that the performance estimate resulted in 2088 MWh/year we can qualitatively conclude that the performance estimate has a minor degree of conservativeness, approximately 5.3%.
This means that our assumptions about the design were close but not completely accurate. We will now consider selected parameters and discuss how these values can affect performance.
Thermal Loss Parameters
These parameters usually refer to the convective effect of temperature and winds which can result in cooling down of the modules and increase the performance of the system. In the performance estimate we assumed the constant loss factor (Uc) of 29 W/m2k, we have not taken into account any wind loss factor (Uv) as we don’t information about site wind conditions. In reality there would be wind blowing on the site at different times of the year and this would improve the performance of the modules. Therefore, not adding the wind loss factor in our simulations makes the result slightly conservative.
Ohmic Loss Factor
We have assumed DC voltage drop of 3% and AC voltage rise of 2% at STC conditions, these values have been assumed in accordance with the standards. In reality these numbers are slightly lower, which means again our modelling parameters are conservative.
Unavailability Loss
These losses refer to the amount of time the PV system is unavailable, this means that the PV is not exporting any energy as there may be a fault, the system might be turned off for routine maintenance or for testing. Choosing an Unavailability of 1% results in 3.65 Days/year without energy generation. This assumption is fairly arbitrary and is applied to random days of the year. As we have the data for 2018 we can see that there was 5 days of unavailability during the year.
LID Loss Factor
As per default PVsyst value the LID loss is taken to be 2%, but in reality, the value might be lower. This parameter is assumed as 2% as manufacturers do not generally disclose this data.
Conclusion
Looking at the parameters and comparisons we can draw the conclusion that the PVSyst modelled energy generation is conservative compared to one year of actual site generation.
It is important to consider the loss parameters in light of the site conditions, location and experience. It is important to balance owner expectations with realty. In the event of a performance guarantee these results can allow the installer to understand the risk involved with specifying a performance estimate with overly ambitious energy targets, which can have ramifications at later stages when the system under performs and does not meet the energy agreement between parties.
GSES offers engineering consulting services from feasibility through to post installation inspection. We can provide white labelled concept to detailed designs for systems ranging from 30 kW to 5 MW. Please contact us if you have any questions or would like to engage our services.