With the impending closure of Hazelwood and the Prime Minister’s talk of ‘clean coal’, attention on electricity prices in 2017 has so far centred around the effect coal-fired stations have on the cost of electricity. The introduction of a new tariff charge by some utilities which have directly affected some customers from 1st January 2017, known as the residential demand charge, has escaped the
public’s attention.
Currently, Distribution Network Service Providers (DNSPs) in Victoria have introduced residential demand charged in their electricity tariff structure for selected customers, such as customers with high energy consumption levels, or customers who opt-in to these charges.
DNSPs in other states take a variety of stances on the introduction of residential demand charges, although the majority have proposed a residential demand charge of some form, with the option to opt-in or opt-out. More information on specific DNSP’s proposals and the Australian Energy Regulator (AER)’s draft decisions is available on the AER website, available here.
So how will residential demand charge changes affect the residential electricity bill? And can solar and battery storage systems lessen the pain?
What Is a Residential Demand Charge and Why Is It Being Introduced?
The concept of demand charge is not new. Most commercial and industrial energy users already experience a demand charge. However, this is the first time residential customers can be subjected to a demand charge.
A demand charge forms a component of an electricity tariff structure, similar to the daily supply charge. The demand charge is calculated by the highest measured instantaneous power used during a specified period of time, as opposed to a consumption charge which is calculated based on the total amount of electricity consumed. The demand charge can be calculated monthly, or over several months, depending on the tariff structure set by the DNSP.
Demand charges reflect the cost of maintaining an electricity distribution network that is capable of delivering the maximum amount of power drawn by the customer at any one time, and aims to encourage consumers to reduce the intensity of their energy use in order to prolong network infrastructure and generator longevity.
The residential demand charge aims to encourage consumers to reduce their peak demand by charging a fee for this peak consumption at specified times of the day and year. For example, charging a high peak demand charge in summer afternoons would encourage consumers to change their air-condition unit settings, or avoid turning on multiple power hungry appliances at the same time, in order to reduce their demand charge.
The residential demand charges currently introduced by DNSPs are similar to commercial and large business demand charges in that it is also calculated based on the maximum instantaneous power consumption. However, the resident can experience different rates during summer and winter, and the demand charge may only consider electricity demand during a specific time period, e.g. between 3pm and 9pm.
The introduction of any residential demand charge, and whether they will be on a mandatory, opt-in, or opt-out basis, will vary depending on
the DNSP.
What Do the Rates Look Like?
The rates listed in Table 1 show an opt-in residential demand tariff which is currently offered by a Victorian retailer. This tariff structure includes the DNSP residential demand rates. Note that service providers may choose to impose a seasonal variation. In the example below, this is shown as the summer and winter demand charges. The time of day which the demand charge is imposed may also differ between DNSP.
Table 1. Retailer Electricity Energy Charges
| Retailer Electricity Charges | Rate |
| First 6.57534kWh/day (c/kWh) | 21.01 |
| Remaining usage (c/kWh) | 19.80 |
| Summer Demand Charges* | 33.61 |
| Winter Demand Charges* | 14.73 |
| Minimum monthly chargeable demand (kW) | 1.5 |
| Daily Supply Charge (c/day) | 75.13 |
*Demand Charges are imposed between 3pm and 9pm daily.
The Minimum Monthly Chargeable Demand
Residential demand charges may have a minimum chargeable demand. For example, the rates listed in Table 1 describes a minimum monthly chargeable demand of 1.5 kW. This means that if a residential customer never used over 1.5kW of power at any one time over the billing period, the utility will still calculate the demand charges as if there was a demand of 1.5kW, and charge the customer for the available demand.
Not all DNSPs will apply a minimum monthly chargeable demand, but customers may instead see an increase in fixed daily supply charge charges.
Calculating the Residential Demand Charge
A demand charge is calculated based on a customer’s highest measured demand during a particular month or billing period, during a specified time period e.g. between 3pm and 9pm. This value is typically measured using kilowatt (kW) for residential and small business customers and kilovolt-amps (kVA) for medium to large commercial customers. The latter unit takes into account the effect of power factor on the measured
kilowatt value.
The measured maximum demand is multiplied by the demand charge and the number of days in the billing month that falls in specified period.
The demand charge is calculated by the
following equation:
EXAMPLE
A household experiences a residential demand charge of $0.30/kW/day during the months of December and January, imposed between 3pm
and 9pm.
Normally, the maximum demand for this house is around 2 kW between 3pm and 9pm. However, for a week in January, there was a demand spike on a Wednesday, where the household had drawn 2.75 kW of power at around 5pm. As the demand charge is based on the maximum demand for the month, the demand spike will determine the charge, even though it was required for 1 day only.
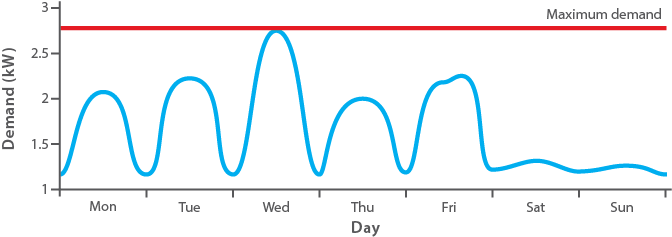
Figure 1 Power demand curve for 1 week at the property, showing a spike on the Wednesday.
The demand charge for January would then be:
Demand charge
= 2.75 kW × 31 days × $0.35/kW/day
= $25.58.
How Much More Would a Customer Pay?
GSES carried out modelling on the effect demand charge would have for a residential customer based on the above rates and using the energy consumption pattern of a Victorian family home with four occupants.
This modelled household has an average energy consumption of 14.98kWh/day and an average daily maximum demand of 1.57kW. Figure 2 and Figure 3 below show the average summer and winter daily energy consumption profile.
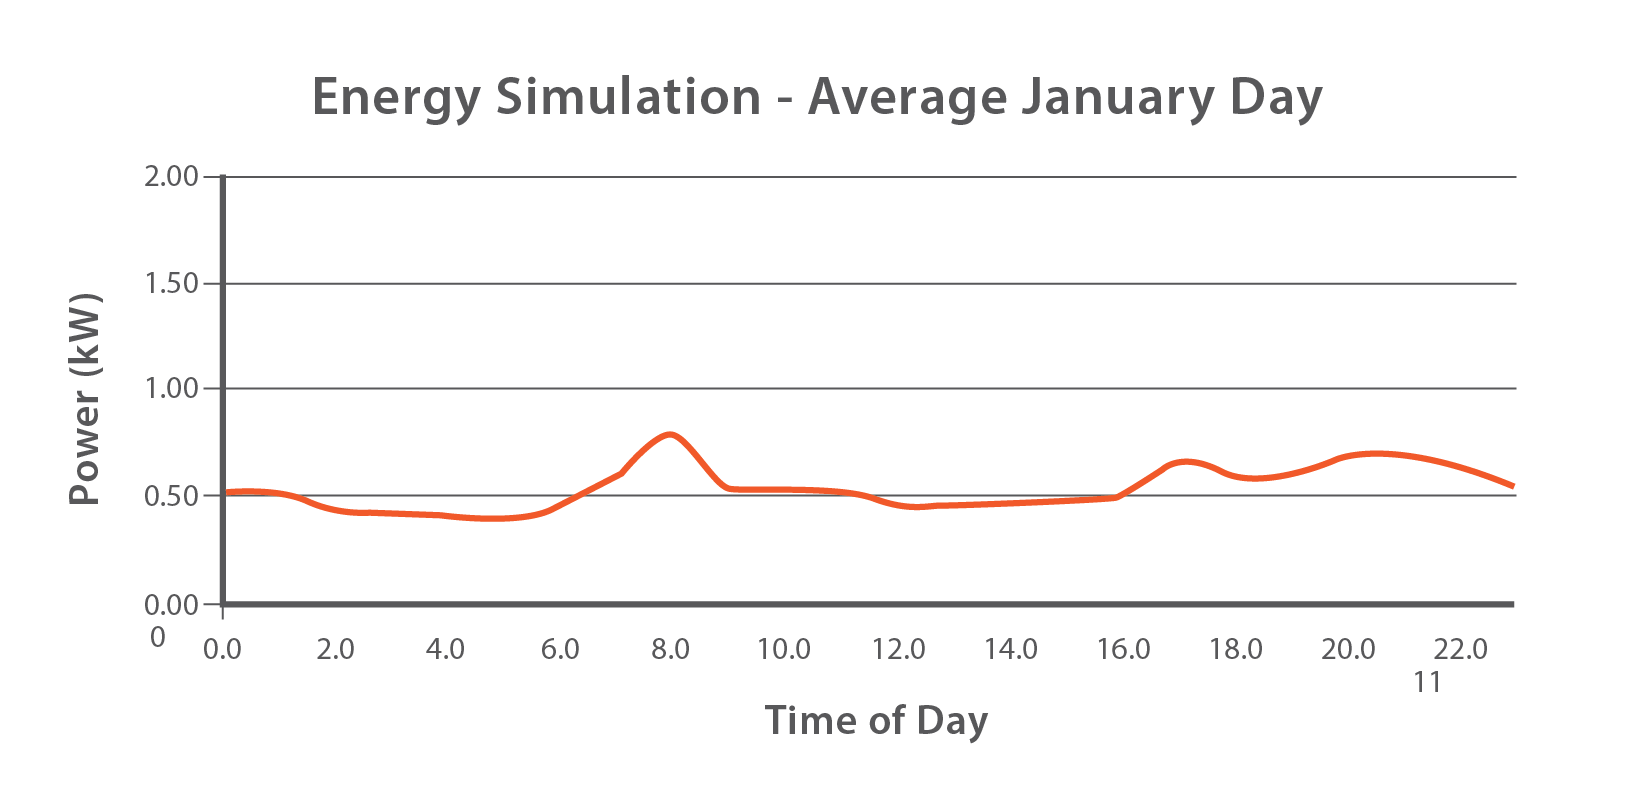
Figure 2. Average January Consumer Load Profile
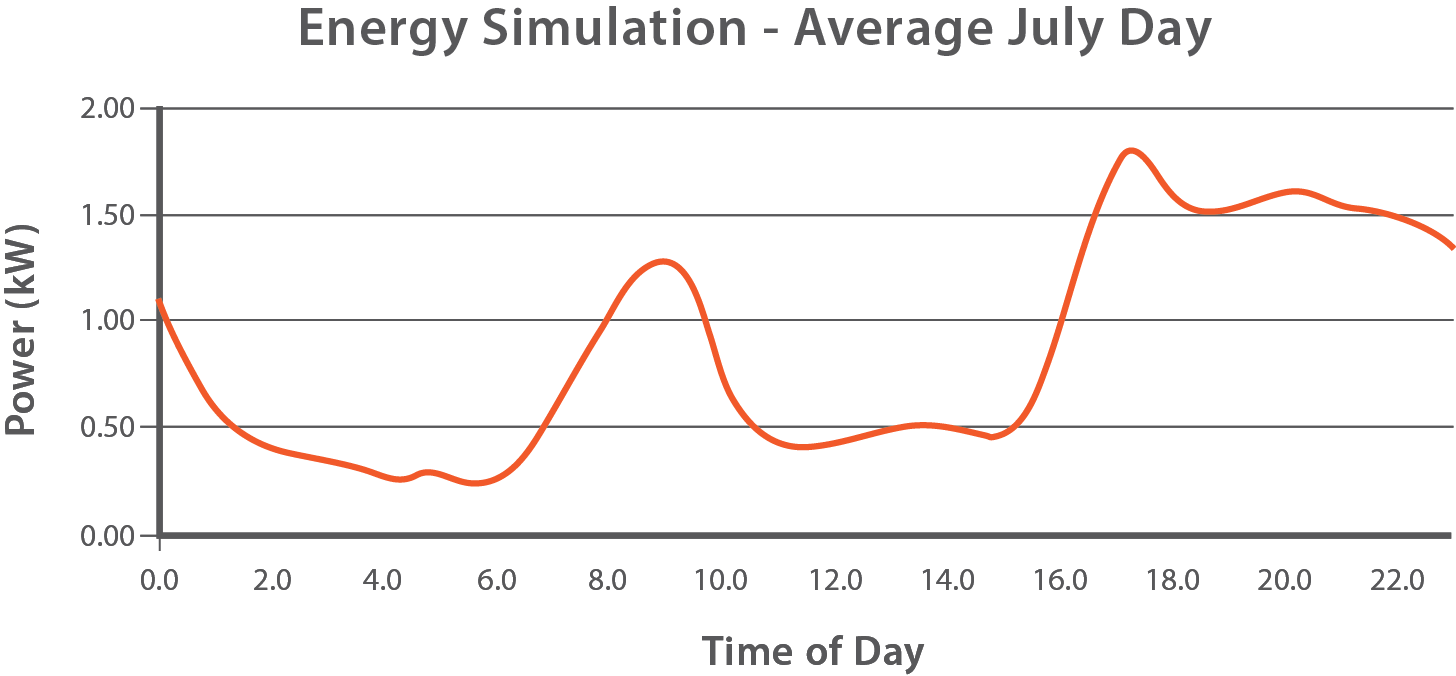
Figure 3. Average July Day Consumer Load Profile
The graphs show that the average Victorian household uses much more energy during winter, presumably for heating, and regardless of season, most energy is being used between 7am and 9am, and after 5pm.
Applying the rates in Table 1, this household’s yearly electricity bill comes to $1,384.44. The residential demand charge, which is calculated from the maximum amount of power that is consumed between 3pm and 9pm for every month, accounts for $172.66 of this bill.
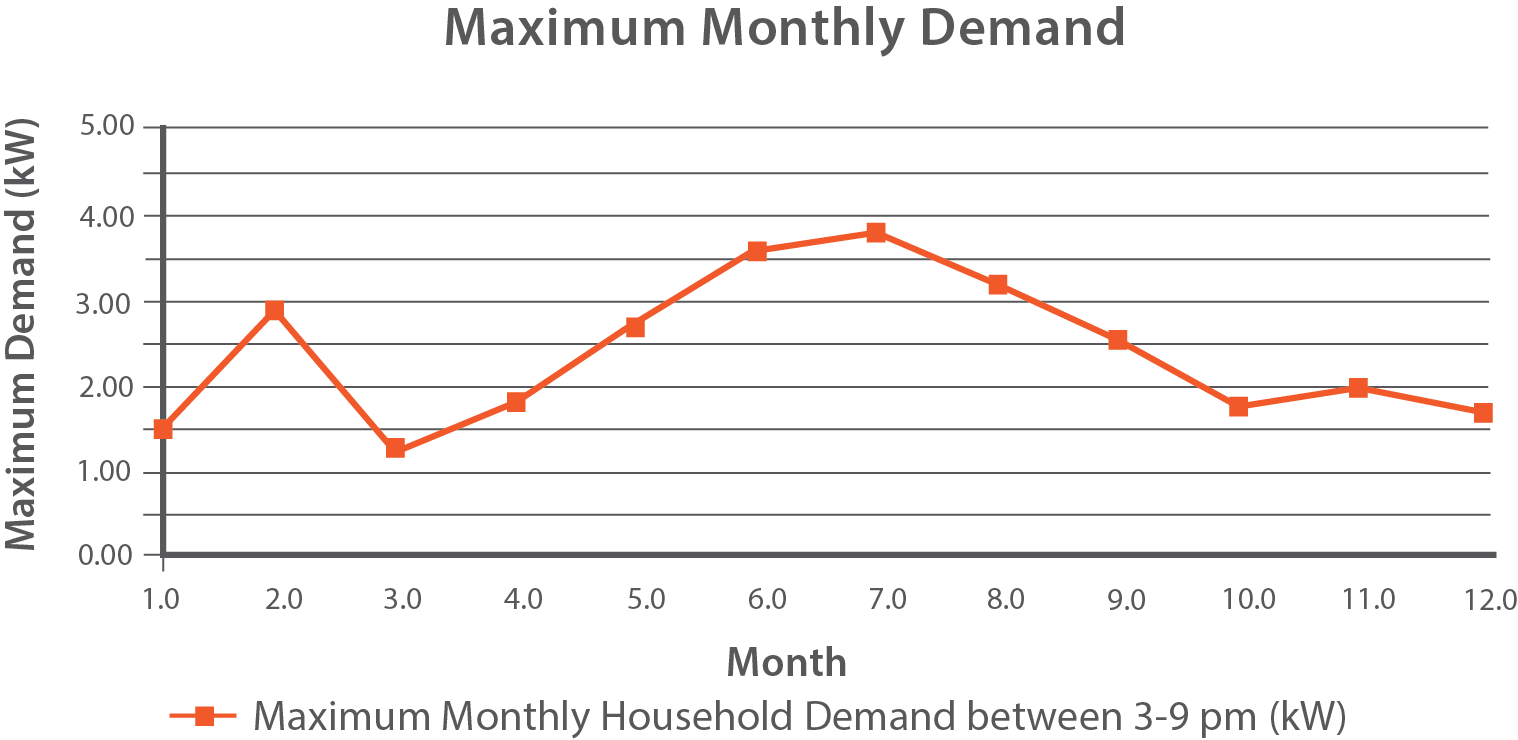
Figure 4. Consumer Monthly Peak Demand between 3pm and 9pm
Figure 4 shows the monthly maximum demand at this household throughout the year. The imposed minimum chargeable demand of 1.5kW does not have a great impact on the consumers demand charge; the modelled household’s peak demand typically exceeded the 1.5kW threshold. The only times consumer peak demand was less than the imposed 1.5kW was in March, where the demand was 1.2kW. The price difference between March actual demand and the 1.5kW chargeable demand came to $2.95.
Where a minimum chargeable demand applies, if the household’s maximum demand is consistently lower than the determined minimum demand, a minimum demand charge will still apply. The minimum demand charge, calculated using rates from Table 1, comes to $114.95/year.
Would Solar or Batteries Help?
Modelling was carried out to investigate the effect of installing a solar PV system, and a solar PV system plus battery storage. The system sizes modelled are:
A 5kW PV array tilted at 30 degrees to the north and 74.7% efficient
A 5kW array with a 6kWh (useable capacity) battery energy storage system.
Effect of 5kW PV Array
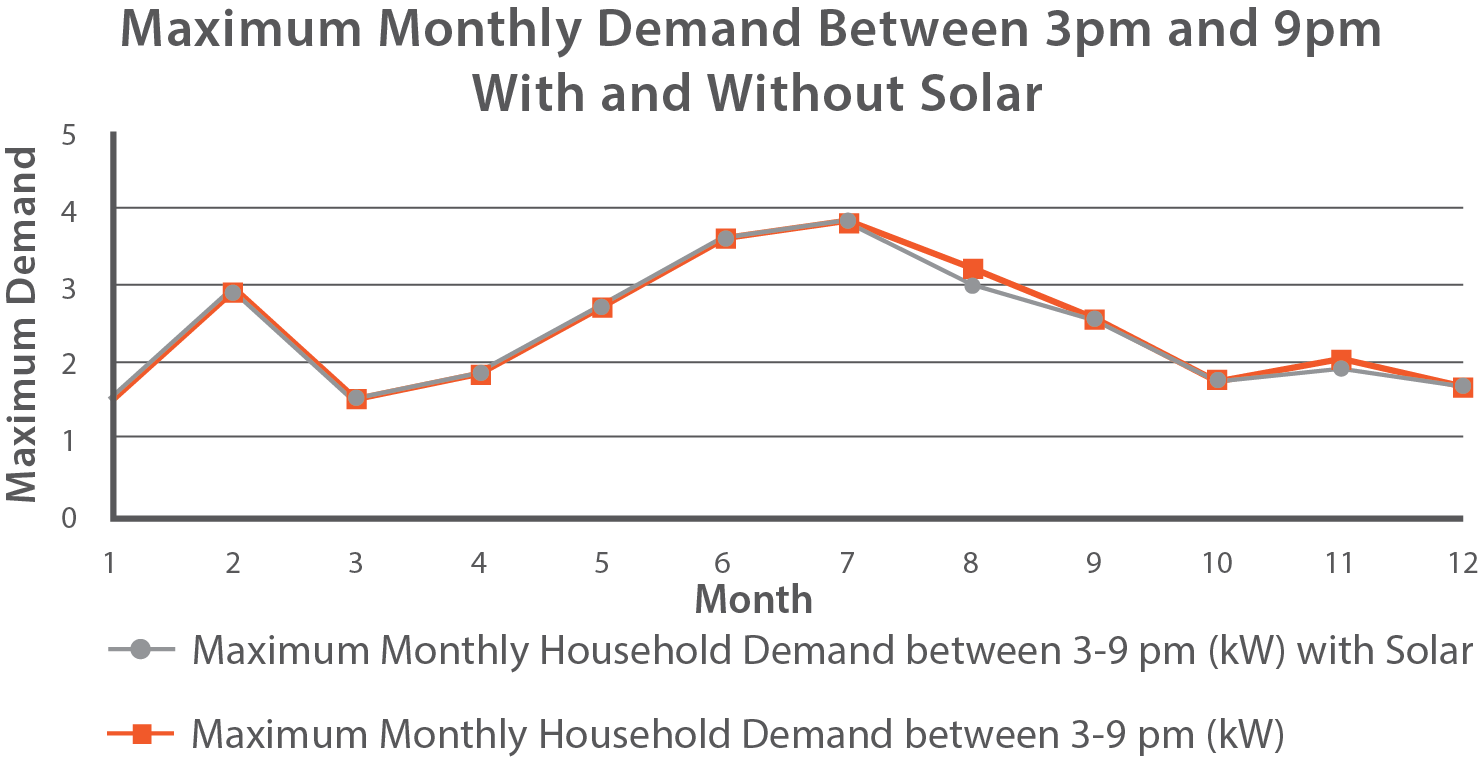
Figure 5. Comparison of Consumer Monthly Demand with and without Solar PV Generation
The figure above shows the marginal difference that solar has on reducing the maximum demand charge. Over the course of the year the 5kW PV system would save the household $1.49 in demand charges. The lack of a reduction on demand charge is due to solar generation being outside of times of high power demand, as power demand typically ramp up after 5pm, when solar generation is ramping down.
However, while solar PV does not reduce the demand charges, the energy displaced by the PV system reduces the household’s yearly electricity bill by $441.98, with feed-in tariff, calculated at 5c/kWh, accounting for $69.92 of this amount. The reduced energy consumption and PV export is illustrated in Figure 6 and Figure 7.
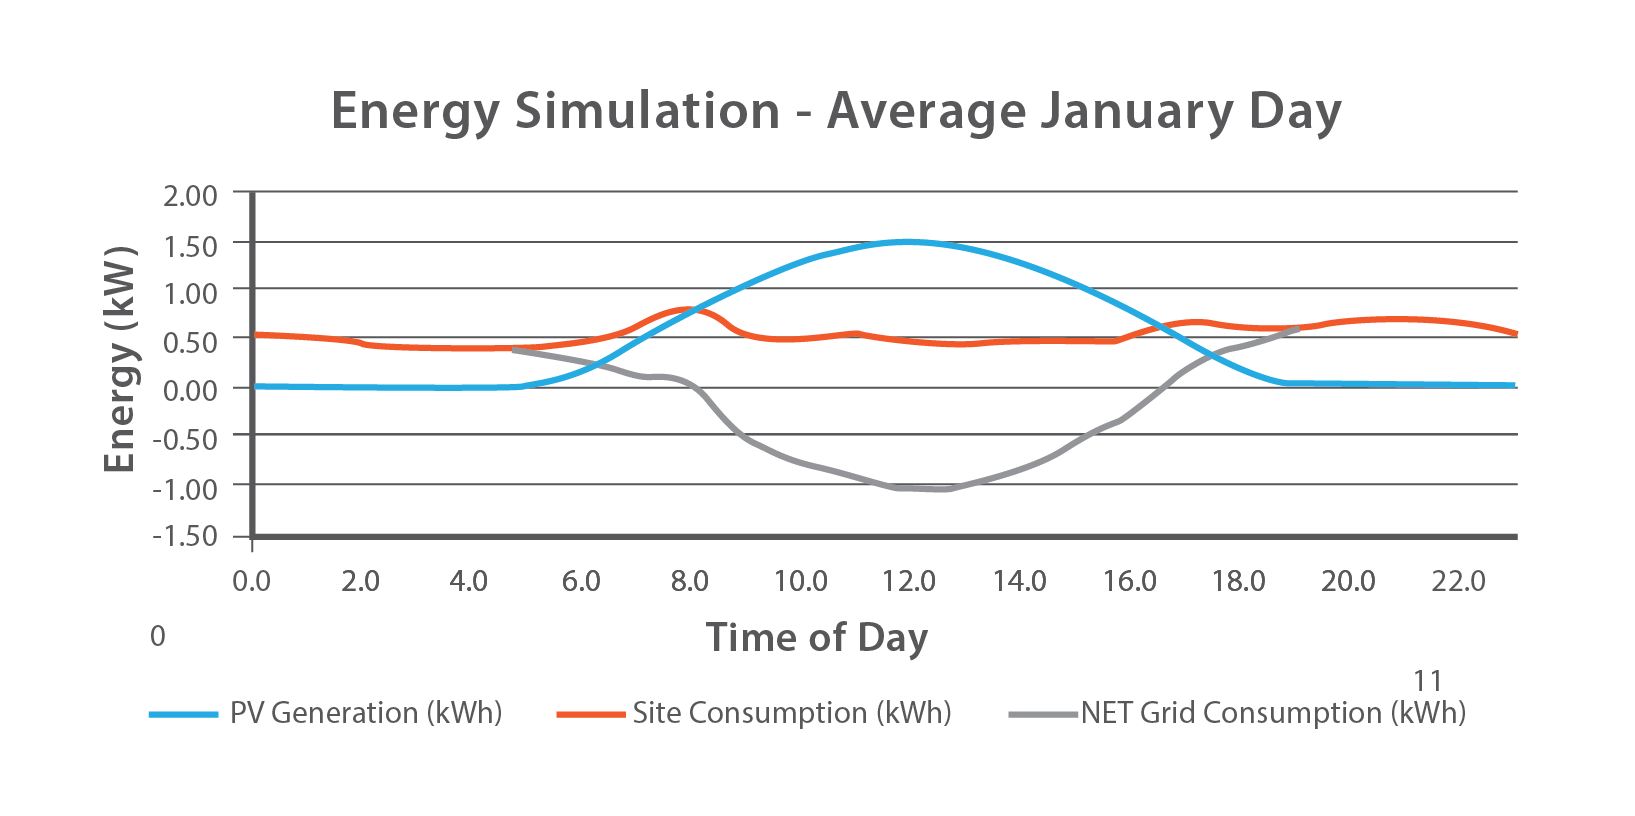
Figure 6. Average January Energy Consumption with Solar PV Generation
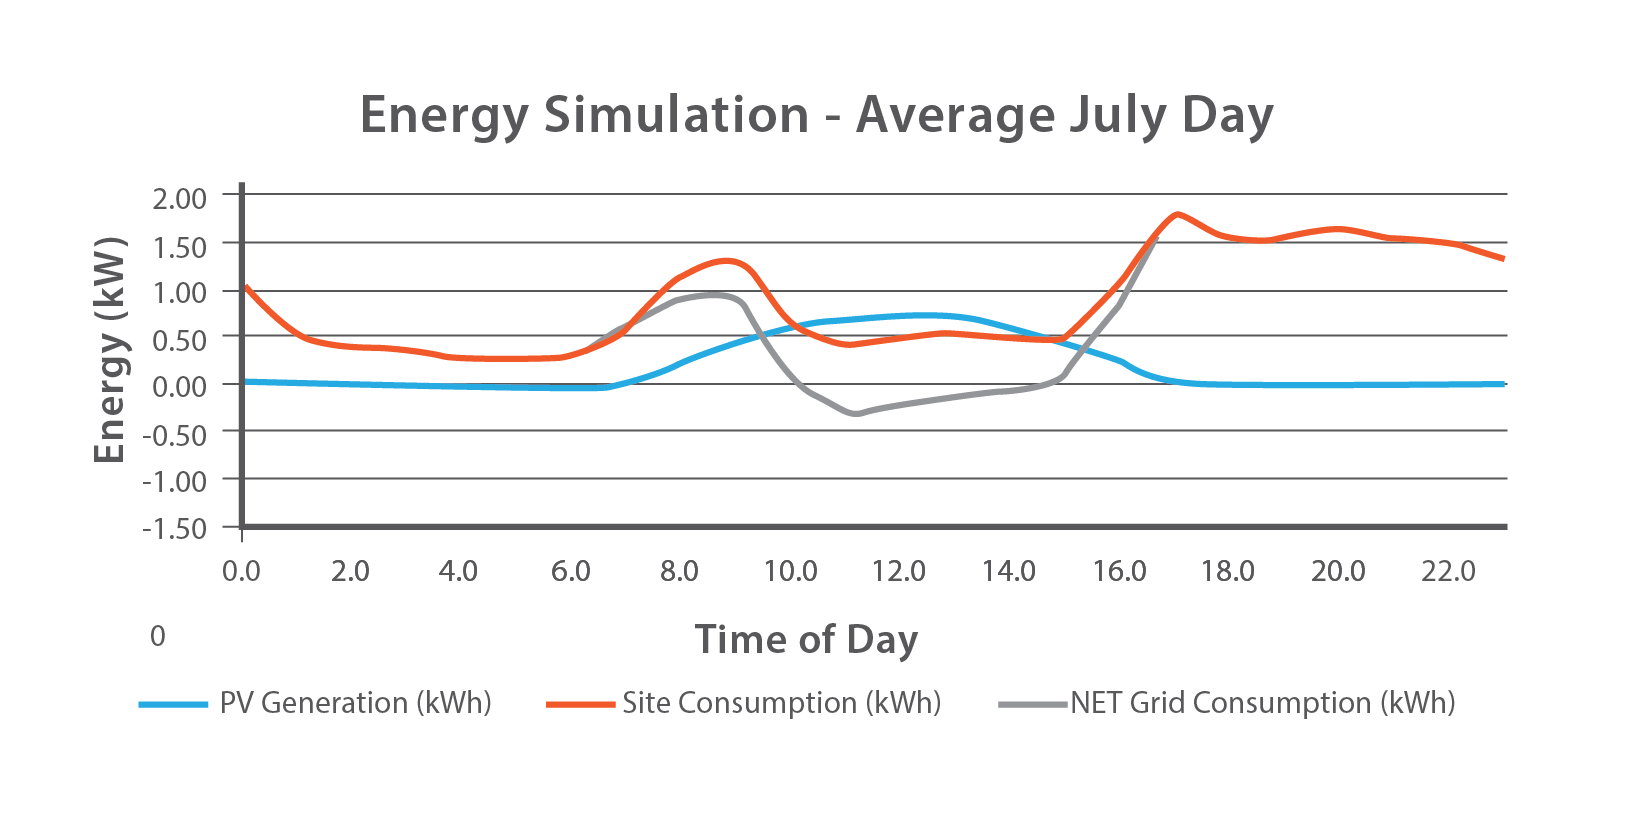
Figure 7. Average July Energy Consumption with solar PV Generation
Figure 6 and Figure 7 also illustrates how the instances of peak power demand falls just outside of sunshine hours. Therefore, no amount of additional PV generation capacity can affect this demand charge without behaviour change.
Effect of 6kWh Useable Capacity Battery Storage System
A battery storage system can be programmed to store excess solar generation to discharge during times of high power demand, in order to reduce the residential demand charge.
A battery storage system with 6kWh of useable capacity was selected for modelling; this was the optimal battery size to capture and make use of all excess solar generation for demand reduction and self-consumption.
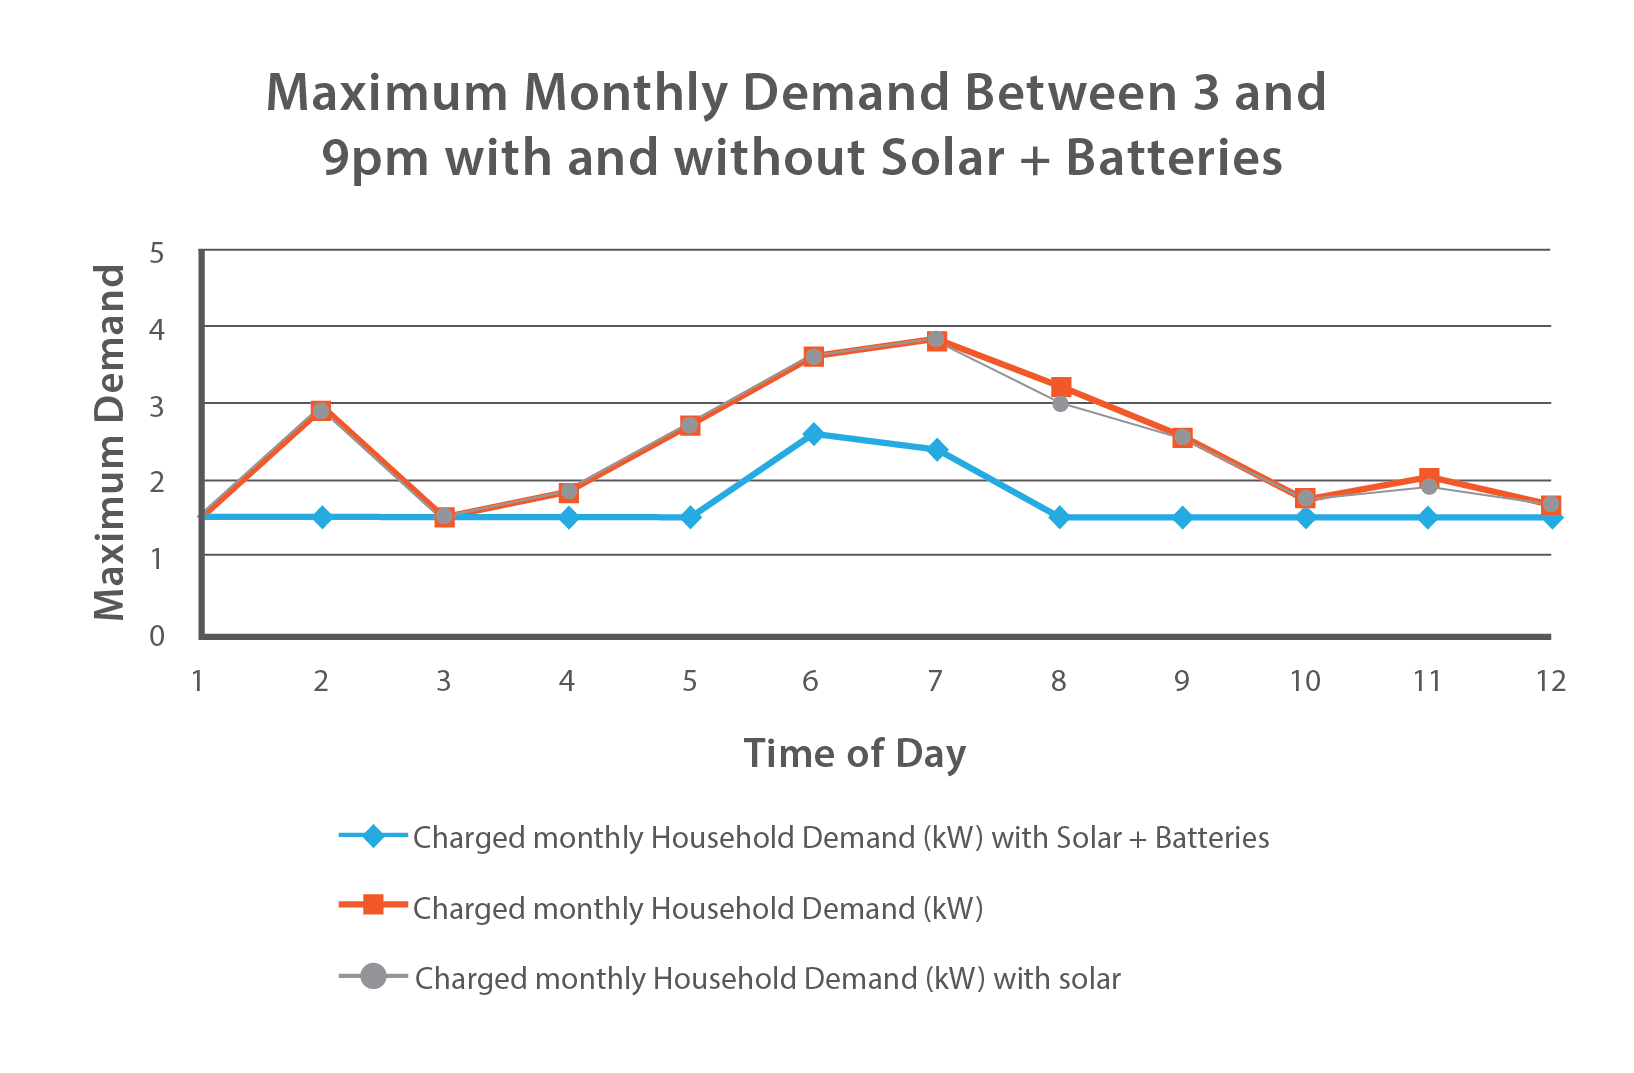
Figure 8. Comparison of Consumer Peak Demand between 3pm and 9pm with and without PV and PV + Batteries
Figure 8 illustrates the effect of a battery programmed to discharge between 3pm and 9pm, compared with no action taken and installation of solar only. It is assumed that the battery is only charged from the excess PV generation. This results in the battery storage system offsetting more demand in summer and less in winter due to solar generation variations throughout the year. The calculated yearly demand cost after batteries is $123.93, a saving of $48.72.
Keeping in mind that the savings are modelled with a minimum chargeable demand of 1.5kW. This means that even when the battery system is completely eliminating power demand between the hours of 3pm and 9pm, the household is charged a minimum of 1.5kW per month.
The benefit of using the battery energy storage system to collect all excess PV generation for self-consumption was also modelled. The modelled financial benefit from 100% self-consumption of PV generation with the use of batteries came to $647.45/year.
Conclusions
The modelling showed that solar PV systems have very little effect on the potential demand charge without behavioural change, and the use of batteries enable a greater reduction in demand charges. However, both solar PV systems and PV plus storage systems can significantly reduce one’s electricity bill.
Table 2. Summary of Consumer Charges and Savings for the three Scenarios
| Scenario | Demand tariff only | Demand Tariff with 5kW Solar | Demand Tariff with 5kW Solar + 6kWh Capacity Battery |
| Net Electricity Bill ($) | $1,384.44 | $942.46 | $688.27 |
| Demand Charge ($) | $172.66 | $171.17 | $123.94 |
| Energy Tariff Savings ($) | $0.00 | $370.57 | $647.45 |
| Demand Charge Savings ($) | $0.00 | $1.49 | $48.72 |
| Solar Feed-in Tariff ($) | $0.00 | $69.92 | $0.00 |
| Total Yearly Savings ($) | $0.00 | $441.98 | $696.17 |
While PV systems and battery storage systems do not greatly reduce residential demand charges, the PV and battery system provider can play a role in helping their customers making informed decisions to reduce their energy costs by:
- Explain the different electricity charges experienced by the customer.
- Offer energy efficiency tips or energy efficiency solutions.
- Discuss ways to shift consumption to the middle of the day, to better utilise PV generation and offsetting peak demand.
- Most importantly ensuring the customer understand what the demand charge is, and what options are available to them to minimise their energy costs.
Setting up a battery energy storage system for specific behaviour requires considerable knowledge of battery programming and available technology. GSES offers training in Grid Connect with Batteries system design and installation, including battery storage system programming. Contact GSES today for more information on training courses.