A solar module generates maximum power when the surface of the module directly faces the sun. For a stationary module facing the equator, this typically occurs during the middle of the day. The high performance of solar tracking arrays comes from the ability to maintain the optimum angle for a longer period of time. The most common types in Australia are the north-south axis trackers which track the sun from the east to west, so-named as its axis runs in the north-south direction.
The theoretical optimum way of positioning north-south axis trackers is to align the axis to true north and true south. However, this is not always possible due to physical constraints such as limited land area and non-uniform land boundaries. Orienting an array axis away from north may trade system performance with ease of installation or increased array capacity within the project area. However, how much generation is lost when the array axis no-longer points to true north? And will the tracker system lose production when it’s farther from the equator?
This article explores the effects of orientation and latitude against the performance of solar tracking. Tracking systems with various orientations at varying latitudes have been modelled in PVSyst and their performance compared with the optimum layout.
This article only examines north-south axis tracking arrays.
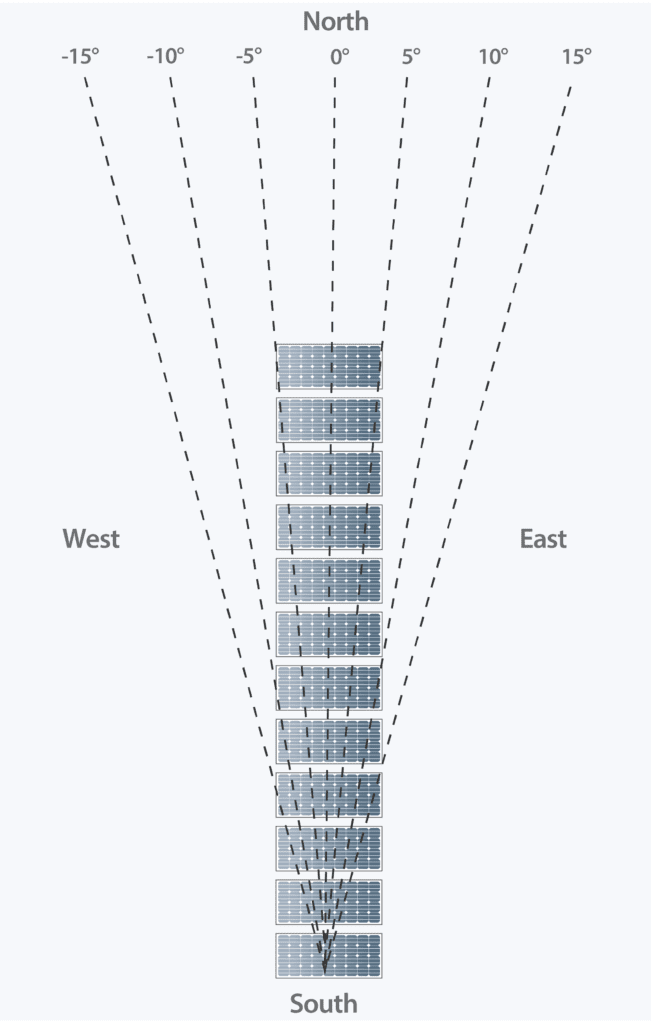
Figure 1: North-South Tracking Array orientated at different azimuth angles with respect to North
Solar Tracking Performance Model Parameters
The system performance with respect to orientation and latitude was modelled in PVSyst (version 7.0). One north-south axis tracker was modelled with 90 modules, totalling 30.15 kWp. The array was matched with a 27kVA inverter. If you are unfamiliar with PVsyst, you can learn online with our PVsyst Short Course Here.
The following parameters were kept constant across all scenarios to avoid discrepancies:
- PV module model: Trina TSM-335DD14A(II)
- Inverter model: Fronius ECO 27.0-3-S
- Albedo Effect: 0.2 (typical ground mount).
- Clear sky model used (i.e no cloudy days simulated).
- Altitude: 0 m
- IAM loss at global default ASHRAE parametrization, with a Bo = 0.05.
- No horizon shading/far field shading.
- Power factor: unity.
- Backtracking disabled (simulation was carried out on a single tracker).
- The minimum and maximum site temperatures for design was kept constant.
- Loss parameters such as thermal loss, module quality loss, LID, module mismatch, soiling, AC and DC ohmic losses were kept constant.
- System unavailability was not modelled.
- No ageing was taken into consideration.
- Meteonorm (Inbuilt in PVSyst) is used to generate synthetic weather data.
Findings/ Analysis
Simulations were completed for a single north-south Axis tracker, with axis azimuth ranging from 345° to 15° across latitudes from 0° to -30°. The following graphs compare the specific energy production, performance ratio and temperature loss at the different latitudes and orientation of the solar tracking array.
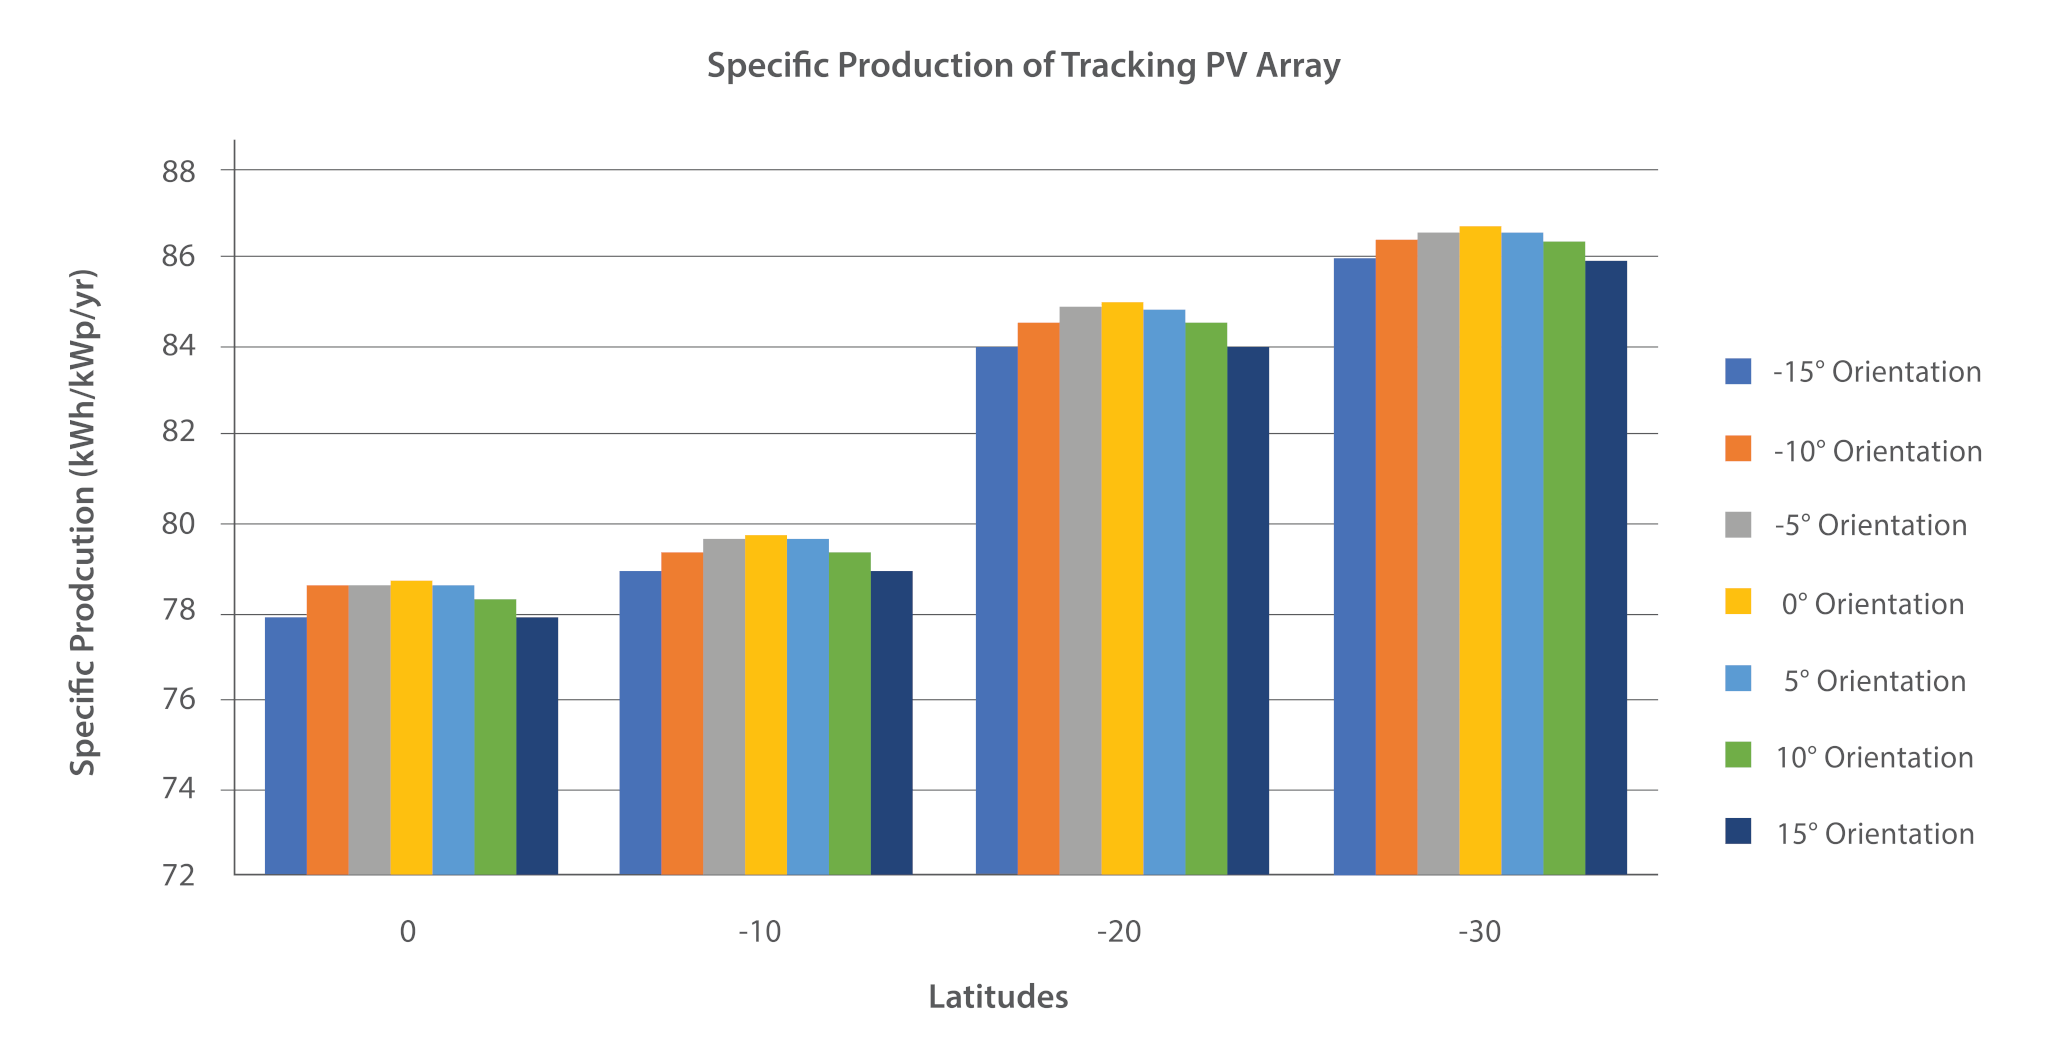 Figure 2: Specific Production of PV Tracker from NW to NE in different latitudes
Orientation’s effect the Performance of Solar Tracking
Figure 2 illustrates the specific production of the systems at different latitudes with the tracker axis facing orientations ranging from -15° W (i.e. 345°) to 15° E. Specific production is graphed as this value can be used to give indicative energy production for any given system size.
It can be observed that across all latitudes the best performance is indeed experienced when the north-south axis tracker’s axis aligned directly north. The loss in specific production as the axis is oriented away from true north is in the range of 27-31 kWh/kWp/yr across all the modelled latitudes. It is also observed that systems perform slightly better when the axis is aligned slightly west of north, i.e. the axis is oriented -15° to -0° and the modules experience slight north-easterly to south-westerly aspects, than when the axis is aligned slightly east of north. This may be because the modules are cooler when they are more optimally positioned in the case of a westerly oriented (east facing) axis.
Latitude’s effect
Surprisingly, comparing the energy production across different latitudes, we can observe that lower latitudes (further away from the equator) tend to perform better. Comparing the production for 0° axis orientation, there is a slight increase of 1.3% between 0° and -10° latitudes, which then increases by 6.5% when comparing -10° and -20° latitudes; and then by 2% between -20° and -30° latitudes. The difference in specific production between 0° and -30° latitude is a surprising 267kWh/kWp/yr.
The increase in energy production with respect to latitude may be due to the fact that, despite the reduced amount of irradiation, the temperature loss at latitudes away from the equator is reduced by ~3%, which improves the overall performance of the system.
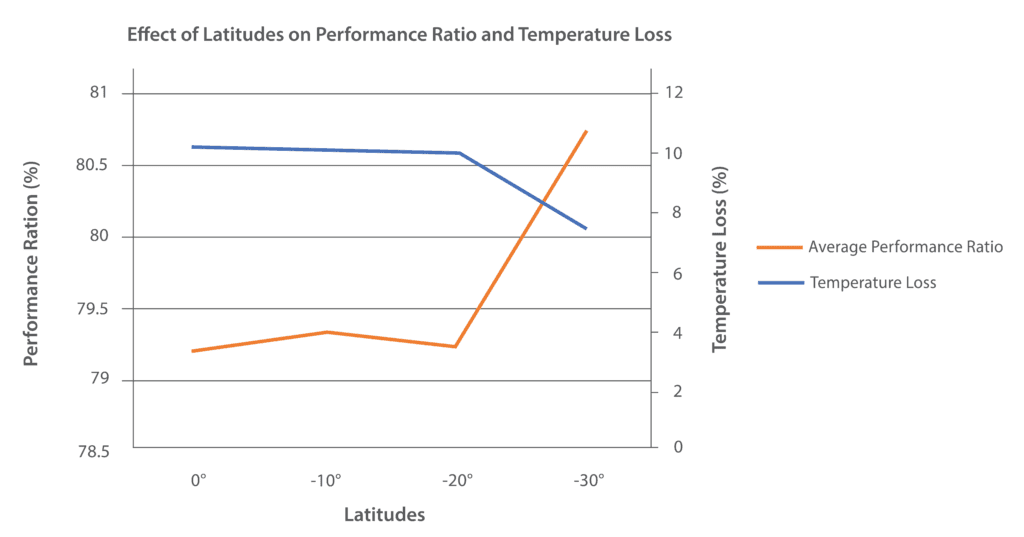 Figure 3: Effect of Latitude on Performance Ratio and Temperature Loss of Tracking PV Array
Figure 3 describes the change in the temperature loss observed when the system modelled moved away from the equator towards lower latitude in the Southern Hemisphere. The temperature loss remained around the same between the latitudes 0°, -10°, and -20°. It is only at -30° when there is sudden drop in temperature loss of about 3%. This also explains the increase in performance ratio, the ratio of the energy the system would effectively produce with respect to the system output if the system was working at its nameplate efficiency.
The reduction in temperature loss could be because the system modelled is no-longer in a tropical climate zone and enters the temperate climate zone. Performance ratio seems to be similar throughout the latitudes 0° to -20°. At -30° latitude we see a gain in performance ratio of ~1.5%. While one would suspect the performance of the system would decrease for lower latitudes as the amount of irradiation decreases, however, it appears that with reduced irradiation the system operates at much cooler temperatures which improves the overall efficiency and performance of the system.
Conclusions
Based on our PVSyst modelling, we confirmed that performance of the north-south axis tracking system performs the best when the tracker axis is – as suggested by its name – oriented exactly along the north south axis. However, if there are physical constraints at the project site such as aspect issues or field boundaries, one can install a north-south axis tracking systems offset up to 15° from true north without significant loss in generation. From our analysis we estimate that a north-south axis tracking system orientated 15° away from north has an approximate specific production loss of ~30 kWh/kWp/yr.
Moreover, installing a tracking system at lower latitude appear to be more beneficial to the overall LCOE of the project as it operates more efficiently with a gain in specific production of ~267kWh/kWp/yr when compared with a system installed at the equator, likely due to more favourable climate and modelling assumptions.
It is worth noting that we have modelled ideal solar systems and specific conditions to demonstrate the broad concept. Site specific factors will affect individual project outcomes. GSES provides a range of competitively priced design services including; pre-feasibility system studies, concept design, construction design, and post installation inspection services. Please contact design@mindaro.energy for a copy of our capability statement or to learn more about our services.
Related Courses
-
 Rapid Solar Systems Sprint Course$45.00
 -
 Single Axis Solar Trackers$165.00
 -
 Utility Scale Solar Projects$165.00