Introduction
Battery energy storage is essential to stand-alone PV power systems relying on intermittent renewable energy as the primary generation source, and the sizing of this battery storage has long been a critical and sometimes contentious issue in the industry. Due to the nature of stand-alone power systems, it is always necessary to size the battery according to the site-specific loads, customer requirements and customer expectations.
The industry has adopted the term “days of autonomy” as one way of specifying the size of battery storage with reference to the site’s particular needs; this is defined as the number of days that the battery can supply the site’s loads without any support from generation sources. For example, it is the number of days a stand-alone power system with solar PV and batteries experiencing several days of low solar irradiance can rely solely on the battery before having to operate a fuel generator or lose power (blackout) in the absence of a fuel generator. Autonomy is defined in AS/NZS4509.2:2010 as “The number of days of operation of the power system without energy input from generators before exceeding the design maximum depth of discharge of the battery”. The minimum number of days of autonomy for sustainable system function is generally recommended anywhere from 2 to 5 days, depending on a number of variables.
However, the price of photovoltaic solar modules has dropped greatly in recent years, and it is now far more economical to purchase additional PV generation capacity than battery storage capacity. It is known that even on cloudy days, some solar irradiation is still available. A PV array that has a rated capacity significantly larger than that required by the site loads may be able to generate enough energy even on overcast days to support the battery storage. In this scenario, fewer days of autonomy should theoretically be required, as the batteries are no longer operating for long periods without any substantial energy input. Therefore, a common question now arising in the industry is: Is it reasonable to install an oversized solar PV array and reduce the battery bank’s days of autonomy, while maintaining quality outcomes for a stand-alone power system?
Background
In early 1990s the industry was having issues with vendors selling under-sized systems and customers not being happy with their stand-alone PV power systems. Designing a reliable stand-alone PV power system has to recognise that the available solar irradiation varies daily throughout the year and the customers load energy can also vary. After the launch of the solar accreditation program in 1993 by Solar Energy Industry Association of Australia (SEIAA) to address poor designs, a design guideline was developed and included in the original training courses conducted by SEIAA. This guideline recommended 5 days of autonomy with a maximum depth of discharge of 70%, with the designer confirming with battery manufacturer/supplier that this was appropriate for the equipment.
The 5 days was a typical figure being used at the time, generally for the following reasonsIn early 1990s the industry was having issues with vendors selling under-sized systems and customers not being happy with their stand-alone PV power systems. Designing a reliable stand-alone PV power system has to recognise that the available solar irradiation varies daily throughout the year and the customers load energy can also vary. After the launch of the solar accreditation program in 1993 by Solar Energy Industry Association of Australia (SEIAA) to address poor designs, a design guideline was developed and included in the original training courses conducted by SEIAA. This guideline recommended 5 days of autonomy with a maximum depth of discharge of 70%, with the designer confirming with battery manufacturer/supplier that this was appropriate for the equipment. The 5 days was a typical figure being used at the time, generally for the following reasons:
- It allowed for a number of cloudy days before the system owner might need to start a generator.
- It provided a daily depth of discharge of less than 20% and resulted in the lead acid battery having a high cycle life.
The larger storage capacity also catered for the fact that system designs were often based on the average daily solar irradiation for the worst month of the year. Therefore, on the days when the available irradiation was less than average the battery would provide the deficit energy to the loads and conversely on the days when irradiation was above average then the excess solar would recharge the battery. If the system was not designed on the worst month then a fuel generator would be required to meet the energy deficit or the users would have to reduce their energy usage in the months where the average daily irradiation was less than the value used in designing the system.
Guidance from AS/NZS 4509.2 Stand Alone Power Systems part 2 -System Design
Days of autonomy
The first version of AS/NZS 4509.2, released in 2002, Clause 3.4.7.7 has 3 to 5 days autonomy for systems with manual genset control whilst clause 3.4.7.8 has 5 days autonomy for PV systems with no genset. the 2010 version of AS/NZS 4509.2 reduced the typical days of autonomy. However, could they be reduced even more by using oversized arrays?
A table showing typical days of autonomy for stand-alone power systems is provided in Clause 3.4.7.6 of AS/NZS 4509.2:2010. The table described the typical days of autonomy to be 2 days for systems with automatic start generator and 2 to 3 days for systems with manual start, with the number of days determined in consultation with the user. For systems without generators the days of autonomy should be 4 or 5 days but with consideration provided for local weather conditions such as the possibility of multiple days of low solar irradiance.
Clause 3.4.7.7 appears to contradict the 2-3 days for manual generators recommendation when it states: In hybrid systems with automatic generating set control, the battery may be sized for 3 days or less of energy storage, provided generating set starting components will perform reliably under a frequent start/stop duty cycle. However, in hybrid systems, the generating set is expected to run on a regular basis as part of the generation mix.
Oversupply co-efficient
AS/NZS 4509.2:2002 introduced an oversupply co-efficient, i.e. a capacity oversize factor, for stand-alone systems without a back-up generation set. In Clause 3.4.2.5 it stated: Generators should be sized to allow full recharge of the batteries from maximum depth of discharge in an acceptable time-frame, e.g. 14 days, as well as the capacity to provide an equalizing charge. Provision of equalizing charge is important for lead acid battery operation: a substantial decrease in charging efficiency of the lead acid battery is experienced when the battery is approaching 100% state of charge and particularly when equalisation charge is required. The typical oversupply co-efficient was defined in Table 1 of Clause 3.4.2.5. For stand-alone systems with PV arrays, this value is 1.3 to 2.0.
Solar Resource Analysis
In the early days of system designs, monthly irradiation data, commonly stated as average daily peak sun hours (PSH) was typically used. Now more and more data is available. Within Australia, daily irradiation figures can be obtained for each day over the previous 20 to 30 years for most weather stations from the Bureau of Meteorology (https://www.bom.gov.au/climate/data/).
The granular data from weather stations made it possible to undertake analysis to determine when a stand-alone PV power system could not provide the required daily energy for various days of autonomy given the PV array and battery capacity. In this analysis, the event where the PV and battery could no longer provide the required energy, and a back-up generator would be required, is described as a blackout. The analysis was then combined with increasing the size of the PV array to estimate the PV array oversize required for different days of autonomy. GSES has used the data to undertake analysis for five sites around Australia including:
- Bairnsdale, Victoria
- Parkes, New South wales
- Cairns, Queensland
- Alice Springs, Northern Territory; and
- Darwin, Western Australia.
Each of these sites had 28 years of data.
Method
For each site it was assumed the daily energy requirement was fixed. The average monthly irradiation figures for the site were determined and the worst month was selected in accordance to the requirements of AS/NZS4509.2:2010. The size of the PV array (in kW) was then calculated based on the design principles of AS/NZS4509.2:2010 using typical assumptions for equipment efficiencies.
The days of autonomy was based on the usable energy of the battery in meeting the load. For lead acid batteries the usable energy is reflected by the maximum allowed depth of discharge of the battery as described by the manufacturer (typically 50 to 80%). Lithium-Ion battery manufacturers typically describe the usable energy of their product as between 80% and 100% of the product’s rated energy.
A program was developed that used the actual historical irradiation for each day to determine whether the available usable load energy in the battery (from the preceding day) plus the available energy from the solar array was sufficient to provide the required daily energy each day. If not, then it was deemed a blackout for that day. In doing these calculations the formulae as provided in AS/NZS4509.2, were applied. Hence, when it came to battery efficiency, it was the average battery efficiency being applied and no allowance was provided for the fact that an oversize is required (if there is no generator available) for lead acid batteries as defined in AS/NZS4509.2 to ensure equalisation of the battery is achieved.
For each site tables were produced for:
- 1 day of autonomy;
- 2 days of autonomy;
- 3 days of autonomy;
- 4 days of autonomy; and
- 5 days of autonomy.
For no (zero %) PV array oversizing and various percentages of oversizing, the tables provided:
- average number of blackouts each month and each year;
- number of years, out of 28, the system would have had blackouts; and
- the highest and lowest number of blackouts determined in a year.
Findings: Lead Acid batteries vs
Lithium-Ion Batteries
The estimate frequency of blackouts is unchanged whether the batteries are lead acid or Lithium-Ion. The fact that the Lithium-Ion batteries are more efficient than lead acid batteries resulted in a smaller PV array for a system comprising using Lithium-Ion batteries compared with that using lead acid batteries. As an example, for a daily load energy of 5kWh for Bairnsdale a system using Lithium-Ion batteries required a 2.023kW array compared to 2.403kW array required for the lead acid battery.
The base analysis of the effect of percentage oversizing etc. was therefore the same independent of the type of battery. However, at least 30% of the oversize might be required for lead acid batteries to ensure effective charging. For this reason, GSES believes that the tables shown could be applied to Lithium-Ion batteries directly, however when deciding on oversize percentage and days of autonomy for lead acid batteries then an extra 30% should be added unless there is a back-up generator and the user is prepared to use it.
Another factor not considered in the analysis is the fact that the output of the array degrades over time. This could be ½ to 1 per cent per year depending on the quality of the module. The efficiency and the usable capacity of the battery will typically decrease with time. Therefore, as the system ages the number of blackouts per year will increase. Depending on the user, the energy usage might also increase with time.
Findings: Cycle life vs Depth of Discharge
Figure 1 shows the relationship between cycle life and Depth of Discharge (DoD) for one brand of lead acid battery. These actual cycle life vs DoD can vary for different brands, models and technologies of lead acid batteries.
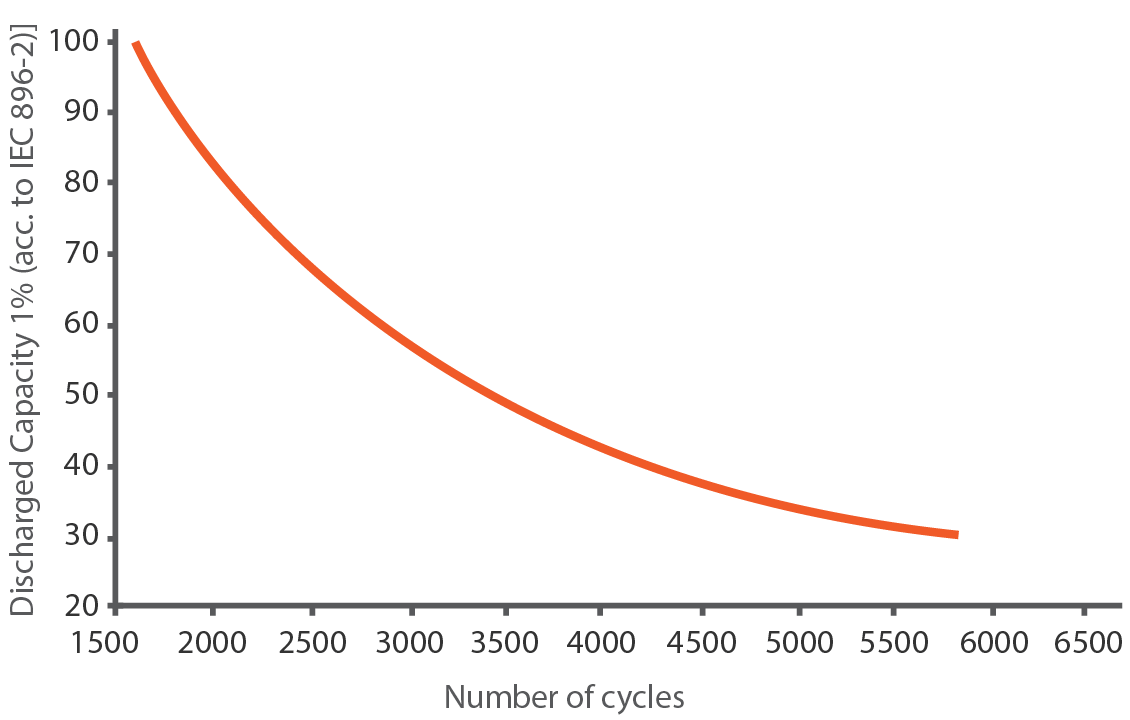
Figure 1 – Number of cycles Vs Depth of discharge (DOD) For Sonnenchein A600 Solar batteries
Assuming that the maximum DoD for the battery is 70% of its capacity (DoD can vary from 50% to 80% depending on battery storage technology), Table 1 then shows the depth of discharge and cycle for the various days of autonomy.
Table 1 – Days of autonomy vs Cycle Life (Lead Acid Battery)
| Days of | Daily Depth of Discharge (%) | Cycle Life (cycles) |
| 1 | 70 | Approx 2300 |
| 2 | 35 | 5000 |
| 3 | 23.3 | >5800 |
| 4 | 17.5 | >5800 |
| 5 | 14 | >5800 |
Lithium-Ion batteries would also have different cycle life based on their depth of discharge, however many of those batteries are rated at 6,000 – 10,000 cycles for the usable energy (maximum depth of discharge) of 80 to 100% of their energy capacity. So, 1-day autonomy would still result in a battery cycling frequently and to a high DoD. Figure 3 shows the effect for one brand of Lithium-Ion batteries.
It is important to remember that the ambient temperature that the batteries are operating will affect the cycle life. For example, for lead acid batteries, for every 10°C above test temperature the cycle life can be decreased by 33% to 50% as shown in Figure 2. Lithium-Ion batteries are also affected by temperature as shown in Figure 3.
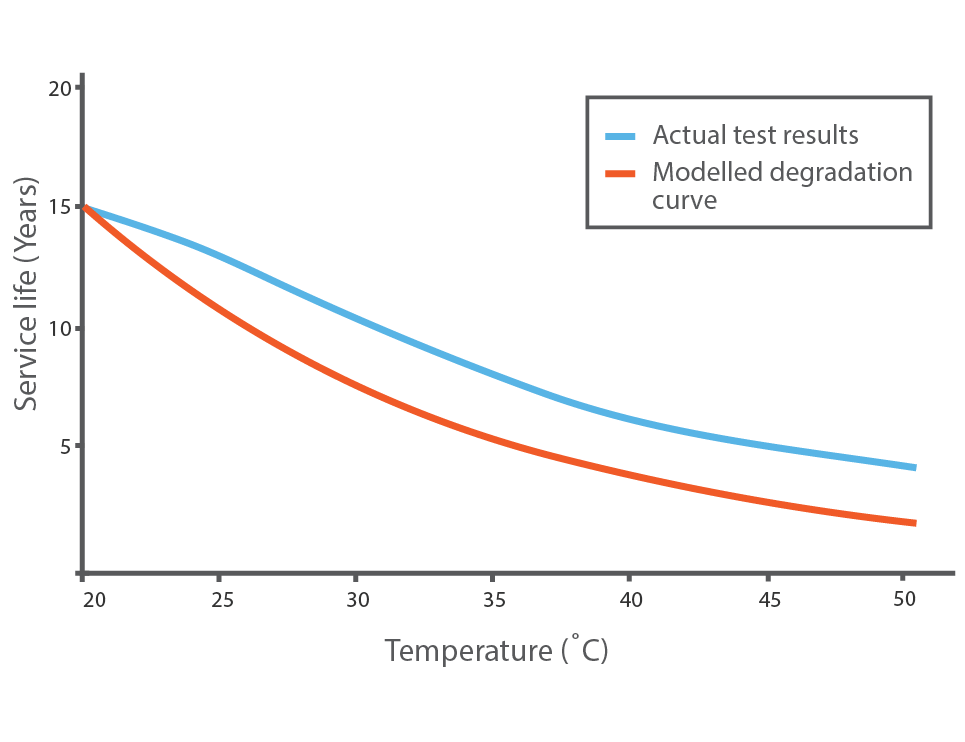
Figure 2 – Service life vs temperature for Sonnenchein A600 Solar batteries
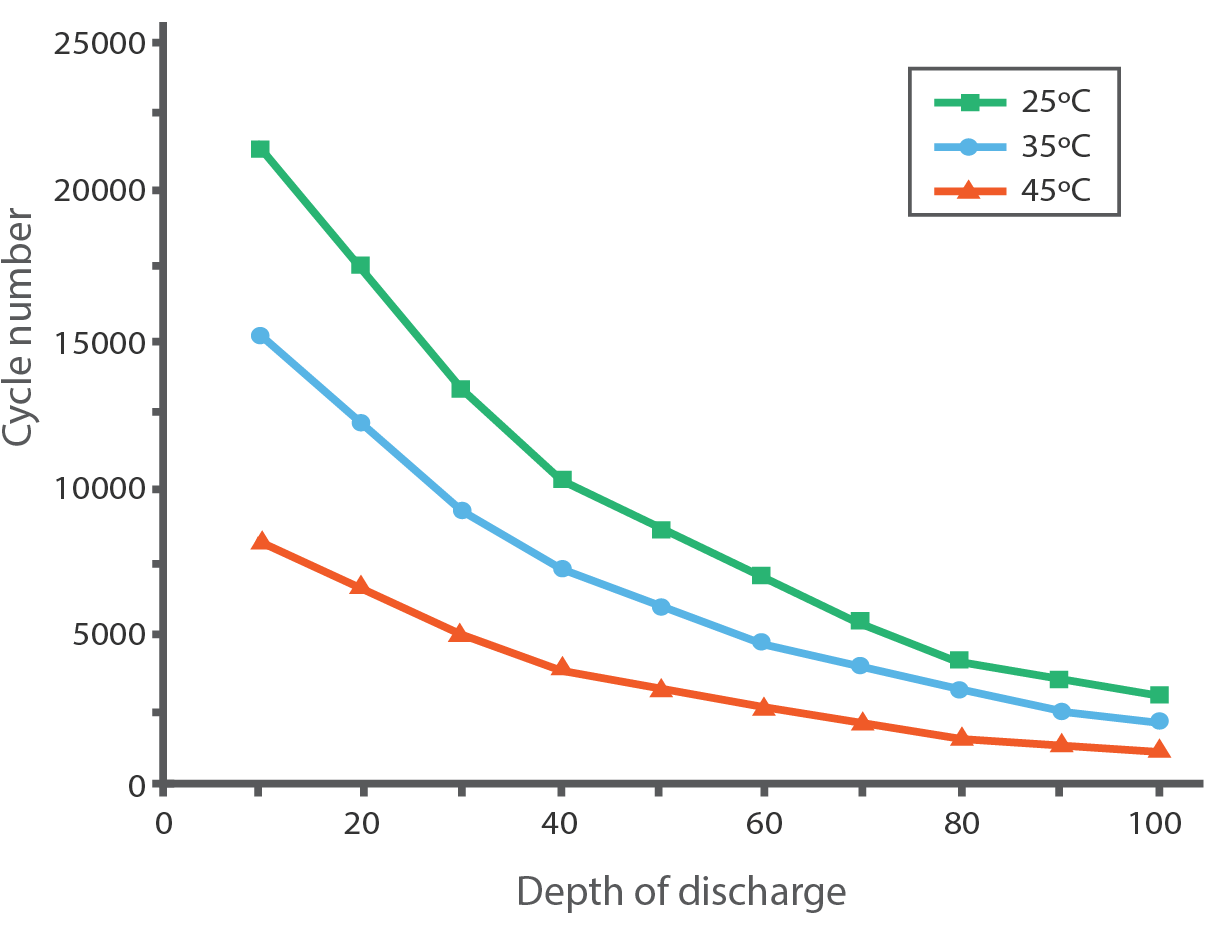
Figure 3 – Effect of Depth of Discharge and Temperature on Cycle life of Lithium-Ion batteries
Findings: Tabulated Results and Discussion
Table 2 shows the average yearly blackouts for the 5 sites studied, while Table 3 shows the possibility of a blackout each year.
Table 2 – Average Yearly Number of Blackouts vs Days of Autonomy – no oversize
| Site | Days of Autonomy | ||||
| 1 | 2 | 3 | 4 | 5 | |
| Alice Spring | 22.17 | 12.03 | 7.38 | 4.62 | 2.66 |
| Bairnsdale | 23.55 | 9.38 | 4.31 | 1.97 | 1.14 |
| Cairns | 41.62 | 25.10 | 16.72 | 12.00 | 8.76 |
| Darwin | 19.97 | 12.83 | 9.28 | 6.34 | 4.55 |
| Parkes | 20.90 | 9.21 | 5.24 | 2.90 | 1.76 |
Table 3 – Possibility of Blackouts in a year vs Days of Autonomy
| Site | Days of Autonomy | ||||
| 1 | 2 | 3 | 4 | 5 | |
| Alice Spring | 100% | 96.4% | 78.6% | 60.7% | 42.9% |
| Bairnsdale | 100% | 100% | 71.4% | 35.7% | 17.9% |
| Cairns | 100% | 100% | 96.4% | 82.1% | 75.0% |
| Darwin | 100% | 96.4% | 89.3% | 78.6% | 53.6% |
| Parkes | 100% | 96.4% | 67.9% | 42.9% | 21.4% |
Increasing the autonomy length to 5 days reduces the average number of blackouts per year by approximately half or more. The possibility of blackout drops significantly for every location except Cairns, with Bairnsdale and Parkes experiencing the highest reduction. Though 5 sites were analysed, to minimise the size of this document, detailed data is shown for 2 sites only: Bairnsdale and Darwin. Tables 4 and 5 show the average number of blackouts per day with no oversizing for Bairnsdale and Darwin respectively.
Table 4- Barinsdale Average Number of Blackouts vs Days of Autonomy
| Month | PSH | Days of Autonomy | ||||
| 1 day | 2 days | 3 days | 4 days | 5 days | ||
| January | 5.09 | 1.59 | 0.41 | – | – | – |
| February | 4.93 | 0.97 | 0.10 | – | – | – |
| March | 4.81 | 1.38 | 0.34 | 0.17 | 0.03 | – |
| April | 4.39 | 1.55 | 0.48 | 0.10 | – | – |
| May | 3.74 | 3.41 | 0.83 | 0.10 | – | – |
| June | 3.47 | 5.52 | 3.41 | 1.97 | 1.00 | 0.55 |
| July | 3.75 | 3.45 | 2.69 | 1.66 | 0.93 | 0.59 |
| August | 4.30 | 1.07 | 0.31 | 0.14 | – | – |
| September | 4.55 | 0.76 | 0.14 | 0.07 | – | – |
| October | 4.77 | 0.79 | 0.03 | – | – | – |
| November | 4.79 | 1.17 | 0.14 | – | – | – |
| December | 4.89 | 1.90 | 0.48 | 0.10 | – | – |
| Total | 4.46 | 23.55 | 9.38 | 4.31 | 1.97 | 1.14 |
| Total number of years with blackout out of 28 | 28 | 28 | 20 | 10 | 5 | |
| Maximum instances of blackout within a year | 40 | 23 | 18 | 12 | 9 | |
| Minimum instances of blackout within a year | 11 | 1 | 0 | 0 | 0 | |
Table 5 – Darwin Average Number of Blackouts vs Days of Autonom
| Month | PSH | Days of Autonomy | ||||
| 1 day | 2 days | 3 days | 4 days | 5 days | ||
| January | 5.06 | 6.45 | 4.59 | 3.48 | 2.69 | 2.03 |
| February | 5.34 | 5.17 | 3.55 | 2.69 | 2.03 | 1.55 |
| March | 6.02 | 2.93 | 1.93 | 1.41 | 0.97 | 0.52 |
| April | 6.50 | 0.69 | 0.17 | 0.03 | – | – |
| May | 6.36 | – | – | – | – | – |
| June | 6.24 | 0.28 | 0.03 | – | – | – |
| July | 6.45 | – | – | – | – | – |
| August | 6.92 | – | – | – | – | – |
| September | 6.91 | 0.03 | – | – | – | – |
| October | 6.72 | – | – | – | – | – |
| November | 6.16 | 0.24 | 0.10 | 0.07 | – | – |
| December | 5.39 | 4.17 | 2.45 | 1.59 | 0.66 | 0.45 |
| Total | 6.17 | 19.97 | 12.83 | 9.28 | 6.34 | 4.55 |
| Total number of years with blackout out of 28 | 28 | 27 | 25 | 22 | 15 | |
| Maximum instances of blackout within a year | 42 | 32 | 27 | 25 | 20 | |
| Minimum instances of blackout within a year | 5 | 0 | 0 | 0 | 0 | |
Tables 6 and 7 show the average number of blackouts per year for Bairnsdale and Darwin respectively with 1-day autonomy and various oversize percentages.
Table 6 – Bairnsdale – 1 day of Autonomy
| Average number of blackout days | |||||||||||
| Oversizing of array | No Oversize | 10% | 20% | 30% | 40% | 50% | 60% | 70% | 80% | 90% | 100% |
| January | 1.59 | 1.14 | 0.90 | 0.66 | 0.52 | 0.52 | 0.34 | 0.24 | 0.24 | 0.21 | 0.17 |
| February | 0.97 | 0.79 | 0.69 | 0.59 | 0.45 | 0.28 | 0.21 | 0.17 | 0.17 | 0.17 | 0.14 |
| March | 1.38 | 0.86 | 0.52 | 0.31 | 0.24 | 0.17 | 0.14 | 0.10 | 0.07 | 0.07 | 0.07 |
| April | 1.38 | 0.83 | 0.55 | 0.41 | 0.41 | 0.31 | 0.31 | 0.24 | 0.24 | 0.17 | 0.17 |
| May | 3.41 | 1.76 | 0.62 | 0.24 | 0.17 | 0.10 | 0.10 | 0.10 | – | – | – |
| June | 5.52 | 2.38 | 1.66 | 1.24 | 0.90 | 0.66 | 0.55 | 0.34 | 0.24 | 0.21 | 0.21 |
| July | 3.45 | 1.45 | 0.86 | 0.62 | 0.41 | 0.28 | 0.17 | 0.14 | 0.14 | 0.07 | 0.07 |
| August | 1.07 | 0.62 | 0.34 | 0.24 | 0.17 | 0.17 | 0.14 | 0.07 | 0.03 | 0.03 | 0.03 |
| September | 0.76 | 0.45 | 0.41 | 0.31 | 0.24 | 0.21 | 0.21 | 0.17 | 0.14 | 0.07 | 0.07 |
| October | 0.79 | 0.45 | 0.41 | 0.24 | 0.21 | 0.14 | 0.07 | 0.03 | 0.03 | 0.03 | – |
| November | 1.17 | 0.97 | 0.83 | 0.48 | 0.41 | 0.31 | 0.21 | 0.17 | 0.14 | 0.14 | 0.14 |
| December | 1.90 | 1.24 | 1.03 | 0.83 | 0.69 | 0.52 | 0.34 | 0.14 | 0.10 | 0.10 | 0.07 |
| Year | 23.55 | 12.93 | 8.83 | 6.17 | 4.83 | 3.66 | 2.79 | 1.93 | 1.55 | 1.28 | 1.14 |
| Summary of Blackouts | |||||||||||
| Number of years out of 28 with blackouts | 28 | 28 | 28 | 28 | 27 | 24 | 24 | 21 | 18 | 17 | 16 |
| Maximum number of blackouts in a year | 40 | 25 | 12 | 15 | 10 | 8 | 7 | 6 | 6 | 5 | 4 |
| Minimum number of blackouts in a year | 11 | 3 | 1 | 1 | 0 | 0 | 0 | 0 | 0 | 0 | 0 |
Table 7 – Darwin – 1 day of Autonomy
| Average number of blackout days | |||||||||||
| Oversizing of array | No Oversize | 10% | 20% | 30% | 40% | 50% | 60% | 70% | 80% | 90% | 100% |
| January | 6.45 | 4.28 | 3.59 | 2.90 | 2.41 | 1.97 | 1.69 | 1.45 | 1.21 | 1.10 | 1.00 |
| February | 5.17 | 3.93 | 2.83 | 2.17 | 1.59 | 1.34 | 1.14 | 0.97 | 0.86 | 0.69 | 0.55 |
| March | 2.93 | 1.97 | 1.38 | 1.28 | 1.03 | 0.93 | 0.86 | 0.76 | 0.62 | 0.52 | 0.48 |
| April | 0.69 | 0.41 | 0.21 | 0.17 | 0.14 | 0.14 | 0.07 | 0.07 | 0.07 | 0.03 | 0.03 |
| May | – | – | – | – | – | – | – | – | – | – | – |
| June | 0.28 | 0.21 | 0.14 | 0.10 | 0.07 | 0.03 | 0.03 | 0.03 | 0.03 | 0.03 | 0.03 |
| July | – | – | – | – | – | – | – | – | – | – | – |
| August | – | – | – | – | – | – | – | – | – | – | – |
| September | 0.03 | – | – | – | – | – | – | – | – | – | |
| October | – | – | – | – | – | – | – | – | – | – | – |
| November | 0.24 | 0.14 | 0.14 | 0.14 | 0.10 | 0.10 | 0.10 | 0.10 | 0.07 | 0.07 | 0.07 |
| December | 4.17 | 2.83 | 1.90 | 1.59 | 1.34 | 1.03 | 0.90 | 0.76 | 0.76 | 0.69 | 0.66 |
| Year | 19.97 | 13.76 | 10.17 | 8.34 | 6.69 | 5.55 | 4.79 | 4.14 | 3.62 | 3.14 | 2.83 |
| Summary of Blackouts | |||||||||||
| Number of years out of 28 with blackouts | 28 | 28 | 28 | 28 | 27 | 26 | 26 | 26 | 25 | 23 | 23 |
| Maximum number of blackouts in a year | 42 | 32 | 24 | 21 | 18 | 16 | 13 | 11 | 11 | 10 | 9 |
| Minimum number of blackouts in a year | 5 | 3 | 2 | 1 | 0 | 0 | 0 | 0 | 0 | 0 | 0 |
As can be seen in tables 6 and 7 even with 100% oversizing a generator would be required to operate at least once each year on average if only 1 day of autonomy was used. This might be acceptable to some users however to be conservative GSES has looked at what oversize is
required for more days of autonomy.
Oversizing Compared to 2 and 3 days of Autonomy
Table 8 – Bairnsdale – 2 days of Autonomy
| Average number of blackout days | |||||||||||
| Oversizing of array | No Oversize | 10% | 20% | 30% | 40% | 50% | 60% | 70% | 80% | 90% | 100% |
| January | 0.41 | 0.14 | 0.07 | 0.03 | 0.03 | 0.03 | – | – | – | – | – |
| February | 0.10 | 0.03 | 0.03 | 0.03 | – | – | – | – | – | – | – |
| March | 0.34 | 0.17 | 0.17 | 0.03 | 0.03 | 0.03 | 0.03 | – | – | – | – |
| April | 0.48 | 0.10 | 0.10 | 0.07 | 0.03 | 0.03 | 0.03 | 0.03 | 0.03 | – | – |
| May | 0.83 | 0.07 | – | – | – | – | – | – | – | – | |
| June | 3.41 | 0.90 | 0.41 | 0.28 | 0.17 | 0.07 | 0.07 | 0.07 | 0.07 | 0.07 | 0.07 |
| July | 2.69 | 0.41 | 0.14 | 0.10 | – | – | – | – | – | – | – |
| August | 0.31 | 0.14 | 0.07 | – | – | – | – | – | – | – | – |
| September | 0.14 | 0.10 | 0.10 | 0.07 | 0.07 | 0.03 | – | – | – | – | – |
| October | 0.03 | – | – | – | – | – | – | – | – | – | – |
| November | 0.14 | 0.03 | – | – | – | – | – | – | – | – | – |
| December | 0.48 | 0.24 | 0.14 | 0.03 | – | – | – | – | – | – | – |
| Year | 9.38 | 2.34 | 1.24 | 0.66 | 0.34 | 0.21 | 0.14 | 0.10 | 0.10 | 0.07 | 0.07 |
| Summary of Blackouts | |||||||||||
| Number of years out of 28 with blackouts | 28 | 19 | 16 | 12 | 8 | 5 | 3 | 2 | 2 | 1 | 1 |
| Maximum number of blackouts in a year | 23 | 8 | 5 | 3 | 2 | 2 | 2 | 2 | 2 | 2 | 2 |
| Minimum number of blackouts in a year | 1 | 0 | 0 | 0 | 0 | 0 | 0 | 0 | 0 | 0 | 0 |
Table 9 – Bairnsdale – 3 days of Autonomy
| Average number of blackout days | |||||||||||
| Oversizing of array | No Oversize | 10% | 20% | 30% | 40% | 50% | 60% | 70% | 80% | 90% | 100% |
| January | – | – | – | – | – | – | – | – | – | – | – |
| February | – | – | – | – | – | – | – | – | – | – | – |
| March | 0.17 | 0.07 | – | – | – | – | – | – | – | – | – |
| April | 0.10 | – | – | – | – | – | – | – | – | – | – |
| May | 0.10 | – | – | – | – | – | – | – | – | – | – |
| June | 1.97 | 0.34 | 0.21 | 0.03 | 0.03 | 0.03 | 0.03 | 0.03 | 0.03 | – | – |
| July | 1.66 | 0.07 | – | – | – | – | – | – | – | – | – |
| August | 0.14 | – | – | – | – | – | – | – | – | – | – |
| September | 0.07 | – | – | – | – | – | – | – | – | – | – |
| October | – | – | – | – | – | – | – | – | – | – | – |
| November | – | – | – | – | – | – | – | – | – | – | |
| December | 0.10 | – | – | – | – | – | – | – | – | – | – |
| Year | 4.31 | 0.48 | 0.21 | 0.03 | 0.03 | 0.03 | 0.03 | 0.03 | 0.03 | – | – |
| Summary of Blackouts | |||||||||||
| Number of years out of 28 with blackouts | 20 | 5 | 3 | 1 | 1 | 1 | 1 | 1 | 1 | 0 | 0 |
| Maximum number of blackouts in a year | 18 | 5 | 4 | 1 | 1 | 1 | 1 | 1 | 1 | 0 | 0 |
| Minimum number of blackouts in a year | 0 | 0 | 0 | 0 | 0 | 0 | 0 | 0 | 0 | 0 | 0 |
Table 10 – Darwin – 2 days of Autonomy
| Average number of blackout days | |||||||||||
| Oversizing of array | No Oversize | 10% | 20% | 30% | 40% | 50% | 60% | 70% | 80% | 90% | 100% |
| January | 4.59 | 2.66 | 2.24 | 1.55 | 1.07 | 0.76 | 0.55 | 0.48 | 0.41 | 0.34 | 0.28 |
| February | 3.55 | 2.14 | 1.38 | 1.10 | 0.69 | 0.41 | 0.34 | 0.14 | 0.07 | 0.03 | 0.03 |
| March | 1.93 | 1.07 | 0.62 | 0.52 | 0.41 | 0.41 | 0.34 | 0.21 | 0.21 | 0.21 | 0.21 |
| April | 0.17 | 0.14 | 0.03 | 0.03 | 0.03 | 0.03 | – | – | – | – | – |
| May | – | – | – | – | – | – | – | – | – | – | – |
| June | 0.03 | 0.03 | 0.03 | – | – | – | – | – | – | – | – |
| July | – | – | – | – | – | – | – | – | – | – | – |
| August | – | – | – | – | – | – | – | – | – | – | – |
| September | – | – | – | – | – | – | – | – | – | – | – |
| October | – | – | – | – | – | – | – | – | – | – | – |
| November | 0.10 | 0.10 | 0.10 | 0.07 | 0.07 | 0.03 | – | – | – | – | – |
| December | 2.45 | 1.52 | 0.93 | 0.79 | 0.66 | 0.52 | 0.41 | 0.34 | 0.31 | 0.21 | 0.14 |
| Year | 12.83 | 7.66 | 5.34 | 4.07 | 2.93 | 2.17 | 1.66 | 1.17 | 1.00 | 0.79 | 0.66 |
| Summary of Blackouts | |||||||||||
| Number of years out of 28 with blackouts | 27 | 27 | 24 | 22 | 19 | 16 | 14 | 12 | 11 | 9 | 9 |
| Maximum number of blackouts in a year | 32 | 22 | 20 | 18 | 15 | 11 | 10 | 9 | 9 | 8 | 5 |
| Minimum number of blackouts in a year | 0 | 0 | 0 | 0 | 0 | 0 | 0 | 0 | 0 | 0 | 0 |
Table 11 – Darwin – 3 days of Autonomy
| Average number of blackout days | |||||||||||
| Oversizing of array | No Oversize | 10% | 20% | 30% | 40% | 50% | 60% | 70% | 80% | 90% | 100% |
| January | 3.48 | 1.90 | 1.24 | 0.90 | 0.52 | 0.31 | 0.24 | 0.14 | 0.07 | 0.03 | 0.03 |
| February | 2.69 | 1.45 | 0.86 | 0.41 | 0.14 | – | – | – | – | – | – |
| March | 1.41 | 0.62 | 0.31 | 0.28 | 0.21 | 0.14 | 0.10 | 0.10 | 0.07 | 0.07 | 0.03 |
| April | 0.03 | – | – | – | – | – | – | – | – | – | – |
| May | – | – | – | – | – | – | – | – | – | – | – |
| June | – | – | – | – | – | – | – | – | – | – | – |
| July | – | – | – | – | – | – | – | – | – | – | – |
| August | – | – | – | – | – | – | – | – | – | – | – |
| September | – | – | – | – | – | – | – | – | – | – | – |
| October | – | – | – | – | – | – | – | – | – | – | – |
| November | 0.07 | 0.03 | 0.03 | – | – | – | – | – | – | – | – |
| December | 1.59 | 0.76 | 0.52 | 0.45 | 0.31 | 0.24 | 0.24 | 0.14 | 0.10 | 0.03 | – |
| Year | 9.28 | 4.76 | 2.97 | 2.03 | 1.17 | 0.69 | 0.59 | 0.38 | 0.24 | 0.14 | 0.07 |
| Summary of Blackouts | |||||||||||
| Number of years out of 28 with blackouts | 25 | 20 | 16 | 14 | 9 | 6 | 6 | 4 | 2 | 2 | 1 |
| Maximum number of blackouts in a year | 27 | 19 | 17 | 16 | 12 | 7 | 6 | 5 | 3 | 2 | 1 |
| Minimum number of blackouts in a year | 0 | 0 | 0 | 0 | 0 | 0 | 0 | 0 | 0 | 0 | 0 |
The current version of AS/NZS4509 allows 2-3 days of autonomy if there is a manual generator available. However, since it also states that it can be less than 3 days if the generator is automatic, we have assumed 3 days autonomy for a manual generator. For Bairnsdale this still would result in:
- 71% (20/28) possibility of having a blackout each year; and
- an average of 4.31 blackouts per year
Only 2 days of autonomy and a 10% array oversize in Bairnsdale would result in slightly better figures than that for 3 days of autonomy and no oversizing, that is:
- 68% (20/28) possibility of having a blackout each year; and
- an average of 2.34 blackouts per year
For Darwin 3 days of autonomy this still would result in:
- 89% (25/28) possibility of having a blackout each year; and
- an average of 9.28 blackouts per year
However, for Darwin, 2 days of autonomy and a 10% array oversize would result in:
- a higher possibility of 96% (27/28) for having a blackout each year; and
- a lower average of 7.66 blackouts per year
Increasing the oversize of array at Darwin to 20%, sizing to 2 days of autonomy, would decreases the chance of blackout to 86% (24/28) and even lower average of 5.34.
Based on decreasing the possibility of a blackout in a year to be less than that for 3 days of autonomy with no oversizing of the array, Darwin would need to be oversized by 20% compared to only 10% in Bairnsdale.
Table 12 provides a summary of the analysis for all 5 locations.
Table 12 – 3 Days of Autonomy (no oversizing) vs Oversizing for 2 days autonomy with oversize
| Location | 3 days of autonomy | 2 days of autonomy | ||||||
| Possibility of Blackout | Average Yearly Number of Blackouts | 10% Oversize | 20% Oversize | 30% Oversize | ||||
| Possibility of Blackout | Average Yearly Number of Blackout | Possibility of Blackout | Average Yearly Number of Blackout | Possibility of Blackout | Average Yearly Number of Blackout | |||
| Alice Springs | 78.6% | 7.38 | 82.1% | 5.3 | 71.4% | 3.45 | 57.1% | 2.48 |
| Bairnsdale | 71.4% | 4.31 | 67.9% | 2.34 | 57.1% | 1.24 | 42.9% | 0.66 |
| Cairns | 96.4% | 16.72 | 96.4% | 11.83 | 85.7% | 7.14 | 82.1% | 4.66 |
| Darwin | 89.3% | 9.28 | 96.4% | 7.66 | 85.7% | 5.34 | 78.6% | 4.07 |
| Parkes | 67.9% | 5.24 | 75.0% | 3.28 | 50% | 1.76 | 42.9% | 0.97 |
Based on decreasing the possibility of a blackout in a year to be less than that for 3 days of autonomy with no oversizing of the array then:
- Alice Springs would need to be oversized by 20%.
- Bairnsdale would need to be oversized by 10%.
- Cairns would need to be oversized by 10%.
- Darwin would need to be oversized by 20%.
- Parkes would need to be oversized by 20%.
Considering the cost of the solar modules and the ageing factor it would be advisable to oversize by more than those suggested above. However, at this stage the 3 days autonomy is what is recommended in AS/NZS4509 and the user should be advised about the likelihood that they will need to operate a fuel generator or experience a blackout.
Oversizing Compared to 5 days of Autonomy
Table 13 provides a summary of the analysis for all 5 locations for comparing 5 days autonomy with no oversizing to 2 days autonomy
with oversizing.
Table 13 – 5 Days of Autonomy (no oversizing) vs Oversizing for 2 days autonomy
| Location | 5 days of autonomy | 2 days of autonomy | ||||
| Possibility of Blackout | Average Yearly Number of Blackout | Oversize | Possibility of Blackout | Average Yearly Number of Blackout | ||
| Alice Springs | 42.9% | 2.66 | 50% 60% | 53.6% 39.3% | 1.59 1.24 | |
| Bairnsdale | 17.9% | 1.14 | 50% 60% | 17.9% 10.7% | 0.21 0.14 | |
| Cairns | 75% | 8.76 | 40% 50% | 78.6% 71.4% | 3.41 2.38 | |
| Darwin | 53.6% | 4.55 | 50% 60% | 57.1% 50% | 2.17 1.66 | |
| Parkes | 21.4% | 1.76 | 60% 70% | 25.0% 17.9% | 0.31 0.24 | |
Based on decreasing the possibility of a blackout in a year to be less than that for 5 days of autonomy with no oversizing of the array then:
- Alice Springs would need to be oversized by 60%.
- Bairnsdale would need to be oversized by 60%.
- Cairns would need to be oversized by 50%.
- Darwin would need to be oversized by 60%.
- Parkes would need to be oversized by 70%.
Other Technical Considerations: Battery discharge and charge current
The initial analysis has only looked at PV array oversizing and days of autonomy. When determining the size of a battery bank for a system this is not the only thing that must be considered. The battery bank must also be able to provide the maximum demand required for the loads. This might be the continuous rating of the inverter that the battery is connected to. The battery must also be able to provide the surge demand.
Particularly for lead acid batteries, the battery capacity used when selecting the battery must be based on the typical discharge current for the battery. The effective available amp-hours from a lead acid battery is dependent on the discharge rate. A battery being discharged at the 1-hour discharge rate has a lower amp-hour capacity than when the same battery is discharged at the 100-hour rate.
Reducing the number of days of autonomy will result in a battery typically being operated at higher discharge rates and hence the lower capacity at this higher discharge rate must be applied.
All batteries also have a maximum charge current. Therefore, when oversizing the array, it is important that the available charging current from the array is not greater than the maximum charging current of the selected battery. Alternatively, there would need to be some form of control to limit the maximum charging current and reduce the charge into the battery accordingly.
Based on the PV array size required for Bairnsdale, Table 14 shows the charge currents, for 48V battery bank, from the respective arrays for the two types of batteries, Lead acid and Lithium Ion.
Table 14 – Charge current from Array
| Charge current from Array | ||
| Oversize Array | Lead Acid (A) | Li Ion (A) |
| 0% | 42.80 | 35.86 |
| 10% | 47.08 | 39.44 |
| 20% | 51.36 | 43.03 |
| 30% | 55.64 | 46.61 |
| 40% | 59.92 | 50.20 |
| 50% | 64.21 | 53.78 |
| 60% | 68.49 | 57.37 |
| 70% | 72.77 | 60.96 |
| 80% | 77.05 | 64.54 |
| 90% | 81.33 | 68.13 |
| 100% | 85.61 | 71.71 |
Based on the usable energy of the Lithium-Ion battery being 90% of the rating and that the Lithium-Ion battery is able to have a maximum charge current equivalent to its watt-hour rating, Table 15 shows the maximum charge currents for Lithium-Ion batteries at the different days of autonomy.
Table 15 – Maximum charge currents of Lithium Ion batteries
| Lithium Ion Battery Maximum Charge current | ||
| Days of Autonomy | Batt (Wh) | Max charge current (A) |
| 1 | 5,974 | 124.5 |
| 2 | 11,947 | 248.9 |
| 3 | 17,921 | 373.4 |
| 4 | 23,895 | 497.8 |
| 5 | 29,869 | 622.3 |
Therefore, the Lithium-Ion battery, even at 1-days autonomy, could accept the charge current from the 100% oversized array.
For lead acid batteries, historically the maximum charge current was specified at 0.1C10 capacity. For example, a 100Ah battery’s maximum charge current was 10A. In practice it could accept a higher charge as long as once the battery reached a specified voltage the charge current was reduced to 0.1C10.
Assuming a maximum depth of discharge of 70% for the lead acid battery, Table 16 shows the maximum charge currents for the lead acid battery for the different days of autonomy based on the maximum charge current being 0.1C10.
Table 16 – Maximum charge currents for Lead Acid batteries 0.1C10
| Lead Acid Maximum Charge current 10A/100Ah | ||
| Days of Autonomy | Batt (Ah) | Max charge current (A) |
| 1 | 160 | 16.0 |
| 2 | 320 | 32.0 |
| 3 | 480 | 48.0 |
| 4 | 640 | 64.0 |
| 5 | 800 | 80.0 |
Comparing to table 14 then without oversizing of the array, the battery bank needs to have at least 3 days of autonomy in order to have a maximum charge current from the array less than the 0.1C10 charge current rating. The maximum array oversizing even with 3 days autonomy
is 10%. With 5 days autonomy it can reach 100% oversize.
However in recent years some manufacturers have started specifying higher charge currents with some up to 0.35C10. Table 17 shows the maximum charge currents for the lead acid battery for the different days of autonomy based on the maximum charge current being 0.35C10.
Table 17 – Maximum charge currents for Lead Acid batteries 0.35C10
| Lead Acid Maximum Charge current 35A/100Ah | ||
| Days of Autonomy | Batt (Ah) | Max charge current (A) |
| 1 | 160 | 56.0 |
| 2 | 320 | 112.0 |
| 3 | 480 | 168.0 |
| 4 | 640 | 224.0 |
| 5 | 800 | 280.0 |
Comparing to table 14 then with 1 day autonomy the maximum oversize is 30%. All other days of autonomy can accept charge currents from 100% oversize array.
Conclusion
A reduction of days of autonomy within a system will significantly increase the number of days of blackouts in a year. Regardless of the days of autonomy designed into a stand-alone system, customers need to be aware of the frequency they are likely to experience loss of power and/or how often they will need operation of a generating set to provide back-up power as a result of the system design.
Oversizing solar PV arrays can compensate for some degree of reduction in the days of autonomy for the battery bank. The present study shows that when reducing the designed days of autonomy from 3 days to 2 days, the PV array needs to be oversized by 10%-20% to maintain outcomes for the system equivalent to or better than 3 days of autonomy. The PV array needs to be oversized by between 50% and 70% to maintain system outcomes equivalent to or better than 5 days of autonomy.
It is important to consider other design constraints, one of which is the maximum charging current of batteries. While lithium-ion batteries are unlikely to experience issues accepting additional charge from an oversized PV array, the maximum charging current of a lead acid battery is limited and directly proportional to its capacity.
Depending on manufacturer specifications, increasing the size of the PV array while also decreasing the capacity of the battery bank may not be feasible for lead acid technologies.
To ensure customer satisfaction, the customer must be clearly informed of the designed system’s capabilities and constraints, regardless of the days of autonomy designed into a system.