
Large-scale ground-mount PV solar projects now have a multitude of mounting options. Single-axis tracking solutions are now more affordable than ever and new mounting designs have been introduced to the market, each with their own benefits and limitations. Every project is unique and has its own set of constraints and design challenges, one of which may be availablility of land area. A project may require an irregular layout due to difficult terrain, or may need to maximise performance within an allocated area to meet contractual requirements. Using PVSyst, GSES has studied the effect of different mounting solutions on PV system performance when the project has limited available space, contrasted with the case where space not an issue.
This study covers three types of commonly used mounting solutions: fixed tilt, single-axis tracking, and east-west racking: an arrangement where PV modules are pitched facing east and west and are installed touching one another. The first scenario modelled compares the three mounting technologies in a situation with an area constraint. The achievable system capacity and generation for each type of mounting solution are compared to explore a client’s ability to achieve a target capacity or energy production target. The second scenario removes the spatial constraint and instead compares the performance of systems with the same installed capacity using different mounting solutions, thereby assessing the direct effect of the mounting design on PV system performance.
Description of Mounting Solutions
Fixed-tilt mounting solutions
This is the most common type of ground-mount solution. Fixed-tilt mounting solutions are used in a wide range of applications from residential- to utility-scale projects. As the name suggests, the mounting solution arranges PV arrays into rows pitched at a fixed angle. The pitch angle is typically optimised to capture maximum solar irradiation throughout the year, but can be pitched to meet seasonal load profile as well. Fixed tilt solutions’ orientation and pitch cannot be changed once installed and are generally oriented towards the equator to capture maximum energy from the sun in the middle of the day.
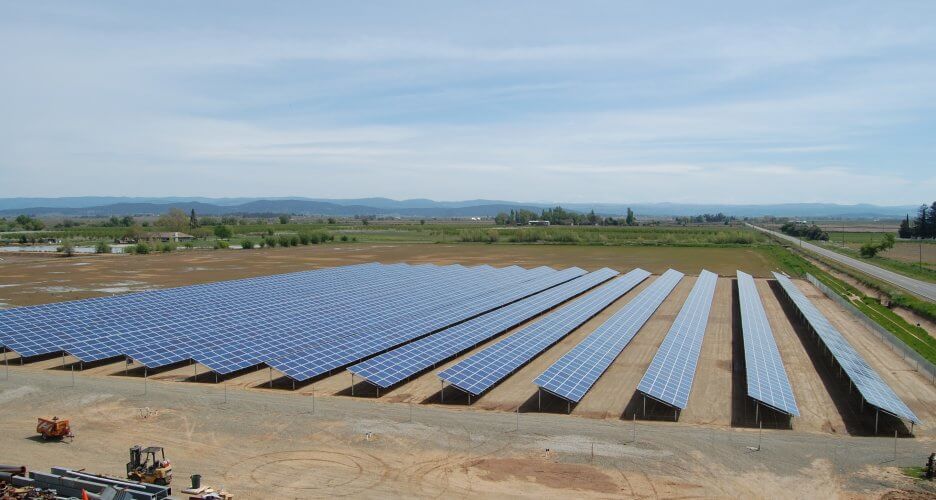
Figure 1 – PV array installed using a fixed-tilt ground mount solution (Source: Tschoder, CC BY-SA 4.0)
Single axis tracking solutions
Single axis tracking solutions track the motion of the sun throughout the day in order to increase daily energy output from the array. The axis of rotation is aligned to true north such that the modules can face east and west when the axis is rotated. The tracking of the sun as it moves from east to west increases system output especially during the morning and afternoon.
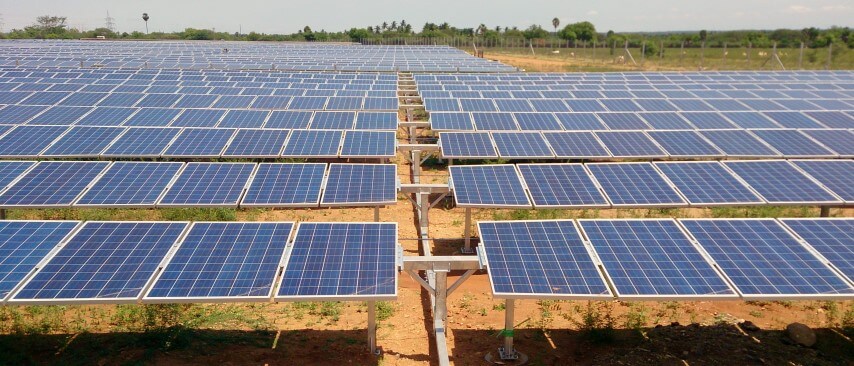
Figure 2 – PV array installed using a single axis tracking solution (Source: Vinaykumar8687, CC BY-SA 4.0)
East-west racking solutions
East-west racking, as shown in figure 3 below, allows for modules to be more closely arranged. The modules are connected along their longer axis at a shallow pitch such that they form ‘peaks’ or ‘waves’. In PVSyst this racking terminology is known as PV sheds or domes. This double-sided shallow pitch allows for large arrays with limited inter- row spacing, increasing the packing density of the array while maintaining the minimum tilt required for self-cleaning. Modules are typically arranged such that they are positioned facing east and west on either side of the ridge, and the shallow pitch means that there are low shading losses regardless of the array orientation. A steeper pitch may be introduced provided attention is given to ensure that the orientation of the array is such that the peaks align with true north.
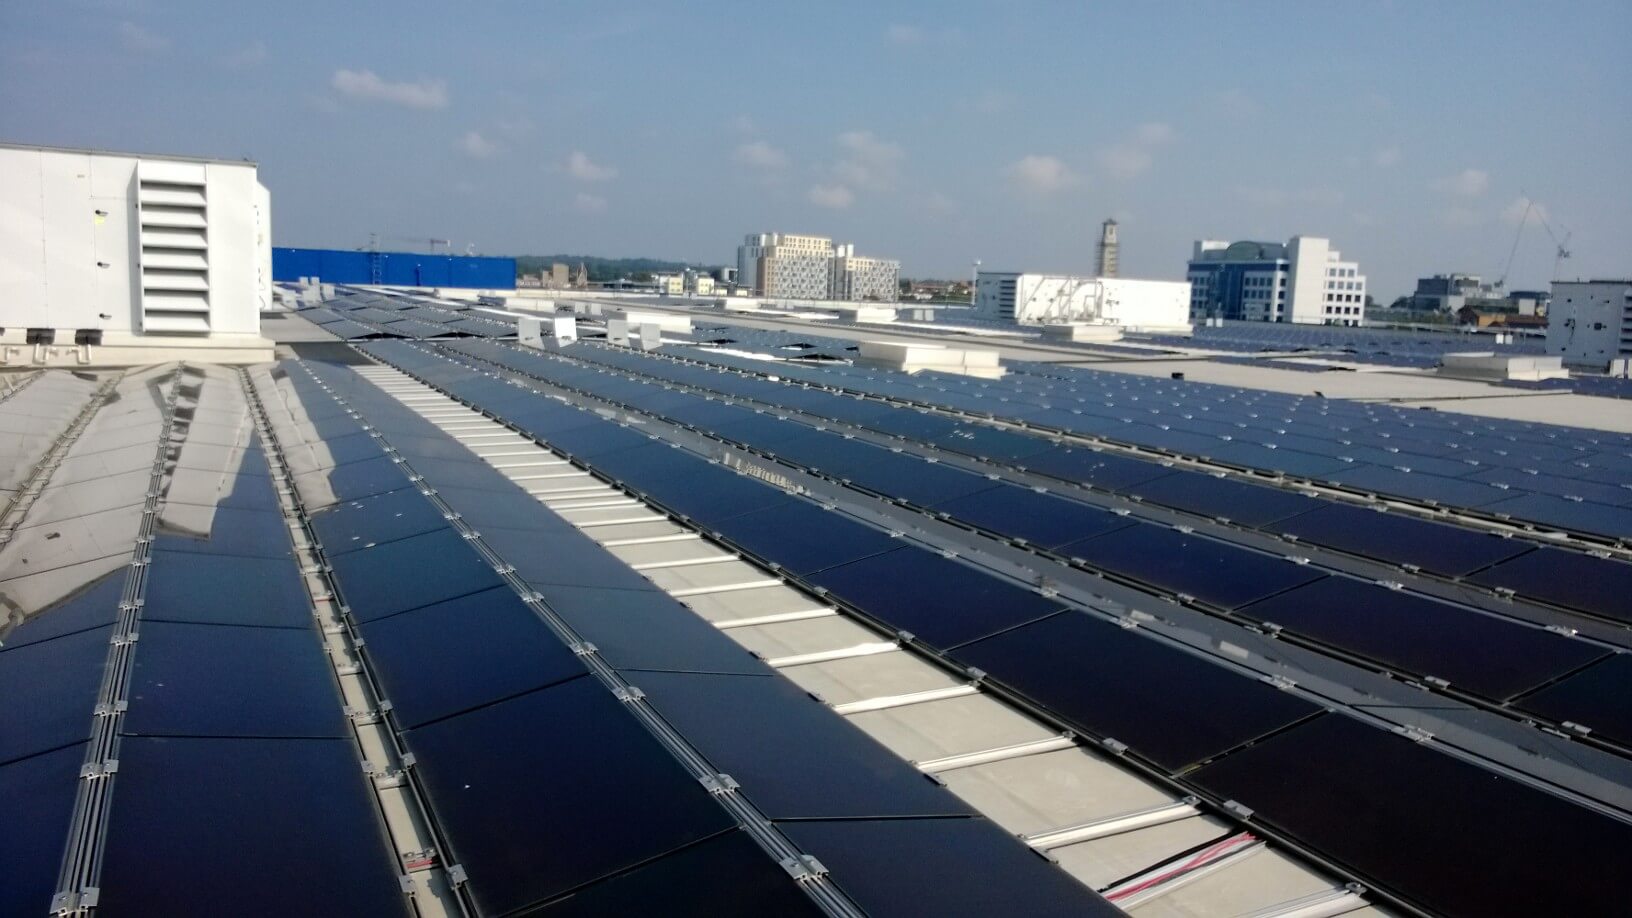
Figure 3 – PV array installed using East-West racking solution (Source: UK Department of Energy and Climate Change, CC BY-ND 2.0)
Scenario 1: Mounting solutions with area constraint
Scenario 1 simulates an area constraint for the three types of mounting solutions. The available area measures 355.5m by 355.5m, with sides of the area boundary aligning with the cardinal directions. This was to simulate an area that can accommodate a large-scale PV system with an array capacity of over 1 MW. PVSyst was used to calculate the output of PV systems using each of the three mounting solutions, packing the available area as tightly as possible.
A variation to this scenario is also conducted: the available area boundary is rotated by 45 degrees to form a diamond shape with respect to equator. This variation shows the mounting solutions’ tolerance to irregular boundaries.
Assumptions:
- Site location: -33.5°, 138.6°, approximately 150 km north of Adelaide.
- Area: 355.5m x 355.5m.
- Simulation Software: PVSyst v6.7.8
- Solar Irradiation Data: Meteonorm 7.2 (from PVSyst v6.7.8)
- Far Field Shading: Horizon file imported PVGIS Data for site coordinates
- Thermal Loss (Uc loss factor):
– Fixed-tilt and tracking: 29 W/m2K (Free Standing, Ground Mount)
– East-West racking: 20 m2K (Semi-Integrated, due to low ground clearance height) - Detailed Losses: All other losses use PVSyst default values.
- Inverter Used: SMA Sunny Central 2500-EV (2500 kW)
- Modules Used: JA Solar 370 W Half Cut modules
All other assumptions such as tilt angles, inter-row spacing are described in comparison study results.
Mounting solution comparison results
Table 1 – Comparison of system performance across different mounting solutions – area constrained
| Comparison Parameters | Square Layout | Diamond Layout | ||||
| Fixed Tilt | Tracking | East-West racking | Fixed Tilt | Tracking | East-West racking | |
| Azimuth | North | East-West | East-West | North | East-West | East-West |
| Inter-row spacing (m) | 9 | 7 | 2.5 | 9 | 7 | 2.5 |
| Module tilt (°) | 30 | 60 to -60 | 8/ -8 | 30 | 60 to -60 | 8/ -8 |
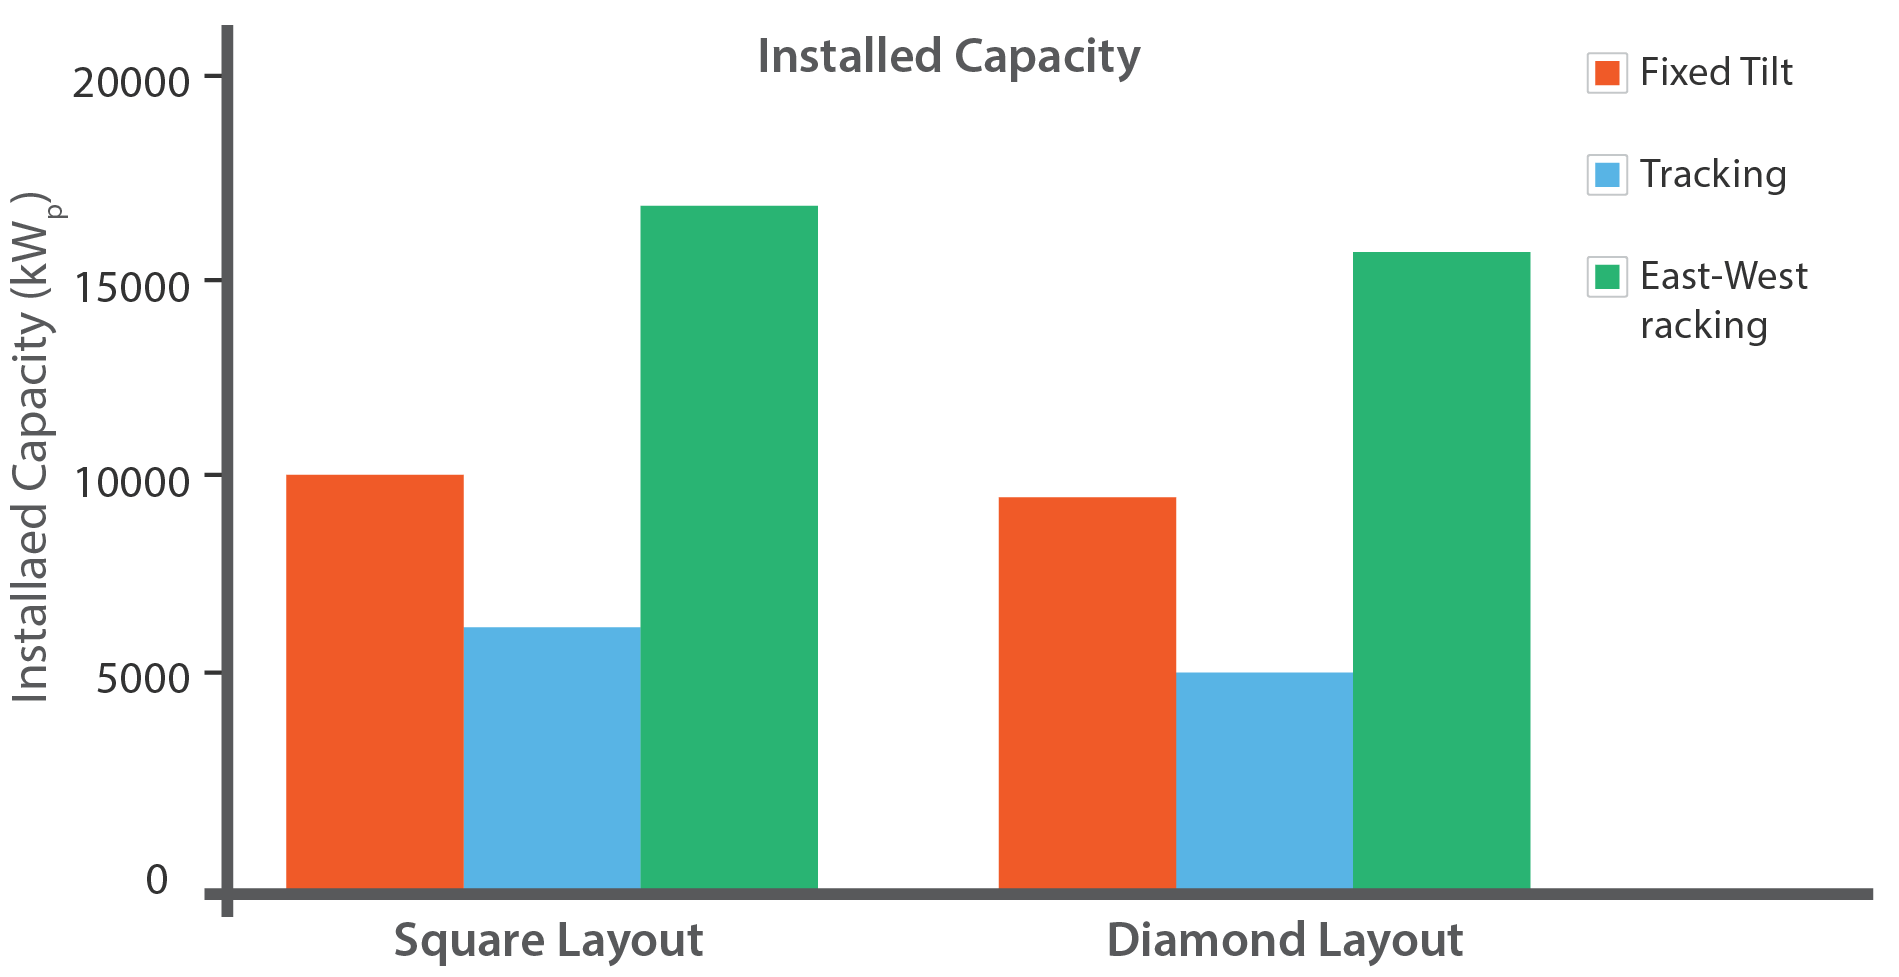
| Installed capacity (kWp) | 10,008 | 6,362 | 17,405 | 9,365 | 5,553 | 15,820 |
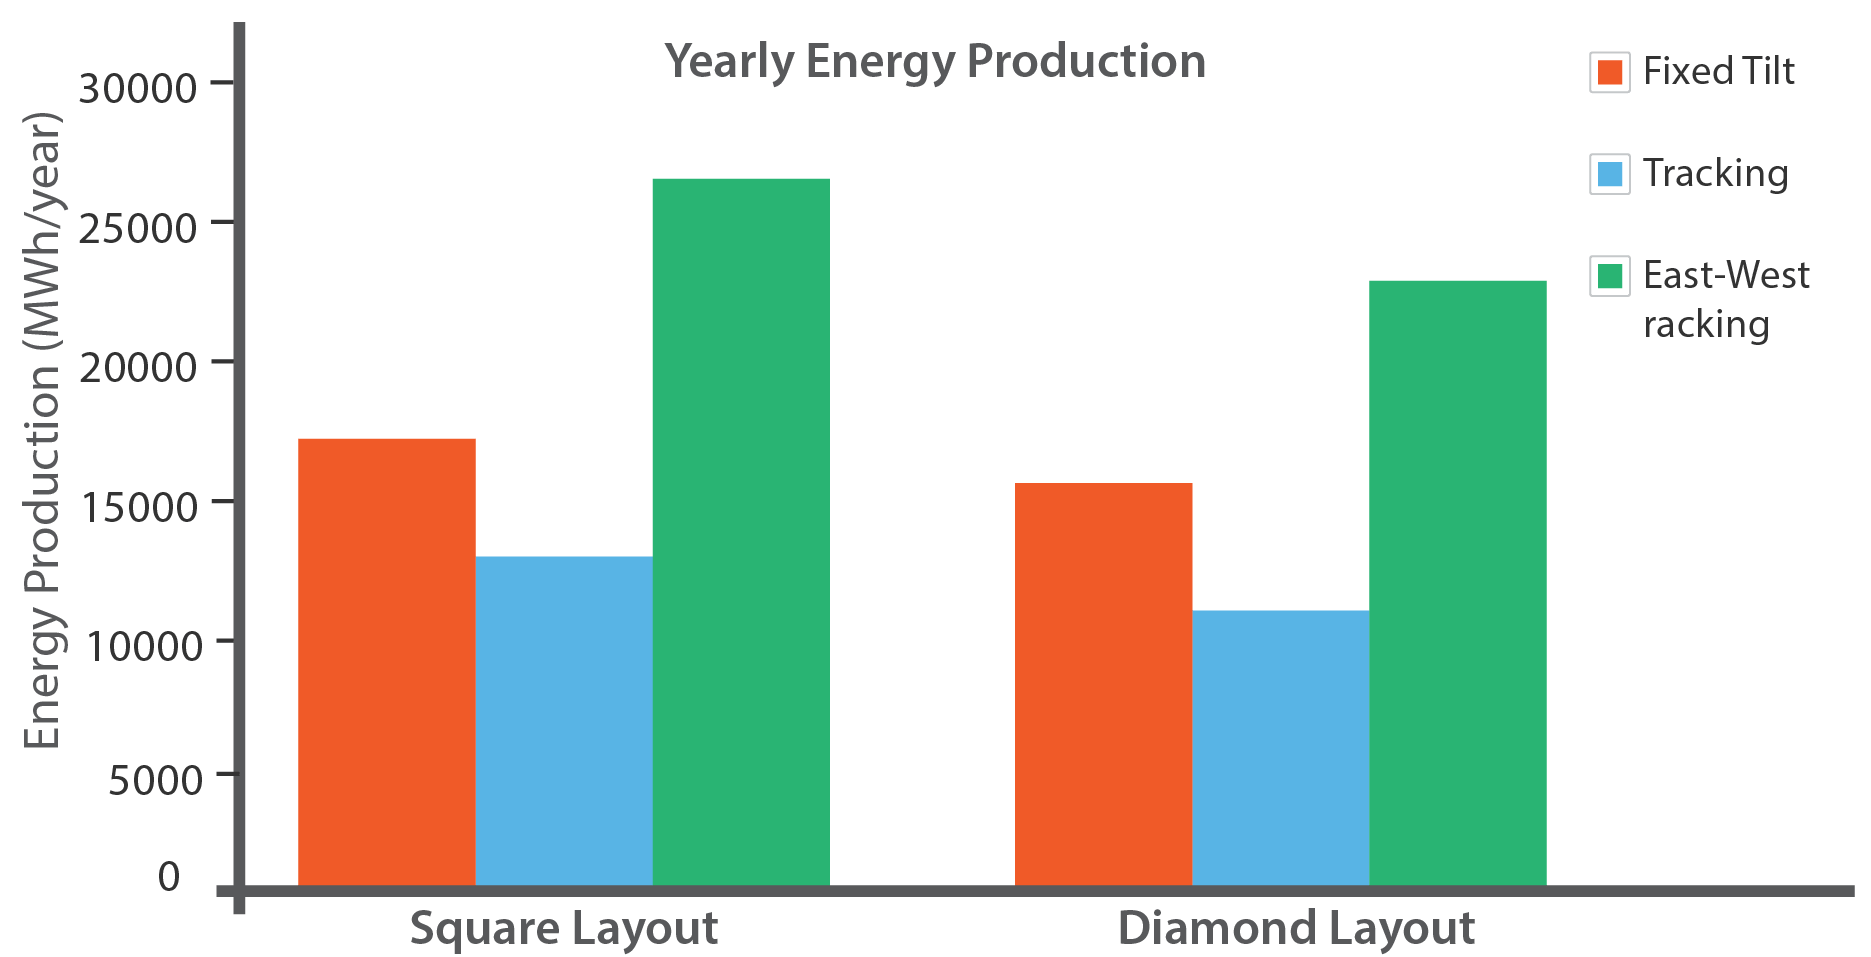
| Yearly energy produced (MWh) | 6,775 | 13,038 | 26,021 | 5,957 | 11,332 | 23,654 |
| Specific yearly energy production (kWh/kWp) | 1,676 | 2,049 | 1,495 | 1,704 | 2,041 | 1,495 |
| Yearly energy production per square metre (kWh/m2) | 133 | 103 | 206 | 126 | 90 | 187 |
| Packing density (kWp/m2) | 79 | 50 | 138 | 0.07 | 0.04 | 0.13 |
Table 1 compares system performance from PVSyst simulations across different mounting solutions. The table shows East-West racking outperforming the other mounting solutions in most of the comparison parameters. The energy produced using PV sheds as dome solutions is higher than fixed tilt and tracking solutions due to its higher packing density, i.e. there is more installed capacity per square metre. The mounting solution creates minimal inter-row spacing between modules by formatting the array into blocks of densely packed sub-arrays only broken by maintenance paths.
Modification of the shape of the available space, simulated through arranging the arrays into a diamond layout occupying the same footprint, finds that the installed capacity dropped across all types of mounting solutions. However, proportionally, the fixed tilt array suffered the least amount of capacity loss as a result of irregular boundary shapes. The relative modularity and design flexibility of fixed tilt mounting solutions enables the array layout to be more readily adapted to the shape of the boundary.
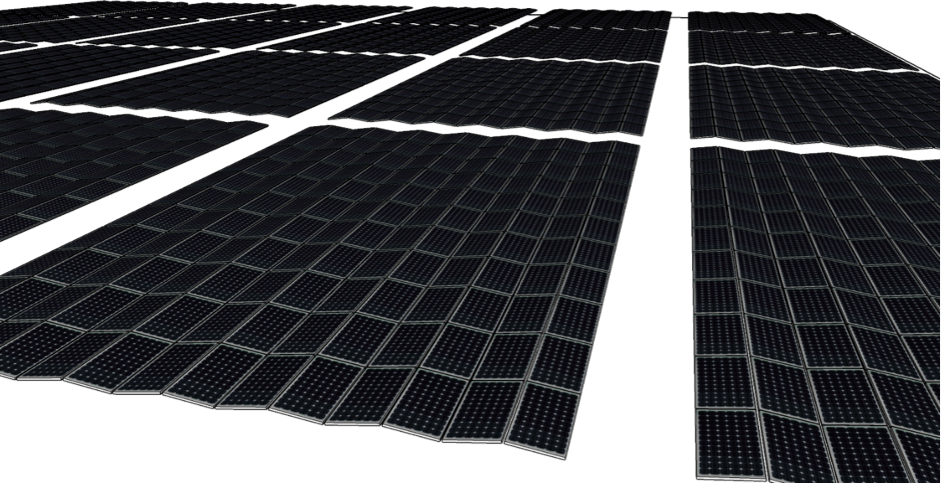
Figure 4 – East-West racking are packed tightly with gaps left at intervals for maintenance access
Key figures of comparison result
Discussion
The PVSyst simulation shows the East-West racking solution as having the best performance in terms of energy production and installed capacity out of the three types of mounting solution simulated in a limited space. In this case, if the client wants higher energy density over the specified area, East-West racking would be a much better solution over fixed tilt and tracking solutions. However, it should be noted that this solution has the smallest specific energy production. This means that it has the lowest energy production per kilowatt-peak of installed capacity. In contrast, the tracking solution dominates with specific energy production
(kWh/kWp), outperforming both fixed tilt and East-West racking solutions.
It is important to note is that while this study identifies general trends, it does not take into account many other design considerations. For example, it does not consider cost variation as affected by varying system capacity, nor does it compare the cost of each mounting solution. Another factor not covered by this study is the daily and seasonal generation profile of the system; while East-West rackinghas the highest overall generation output, its generation profile might not match the desired profile for the site. The module tilt at the array, which can be modified on a site by site basis for fixed-tilt and East-West rackingw, would also change PV system output, in addition to the latitude of the PV system location.
Scenario 2: Mounting solutions without area constraint
In this scenario, the area constraint is removed. Instead, the PV system’s installed PV capacity is limited to 5 MWp and its performance is compared in order to see the effects of the different mounting solutions on system output.
Assumptions:
- All simulations have been conducting specifying 5,004 kWp of PV capacity. All assumptions other than area and system capacity are unchanged.
Comparison of performance parameters
Table 2 – Comparison of system performance across different mounting solutions – area unconstrained
| Comparison Parameters | Fixed Tilt | Tracking | East-West racking |
| Azimuth | North | East-West | East-West |
| Inter-row spacing (m) | 9 | 7 | 2.5 |
| Module tilt (°) | 30 | 60 to -60 | 8/ -8 |
| Module footprint (m2) | 26,805 | 26,805 | 26,805 |
| Installed capacity (kWp) | 5,004 | 5,004 | 5,004 |
| Yearly energy produced (kWh/ kWp) | 8,388 | 10,204 | 7,483 |
| Specific yearly energy production (kWh/kWp) | 1,676 | 2,039 | 1,495 |
| Energy per square metre (kWh/ m2) | 137 | 106 | 212 |
| Packing density (Wp/ m2) | 82 | 52 | 142 |
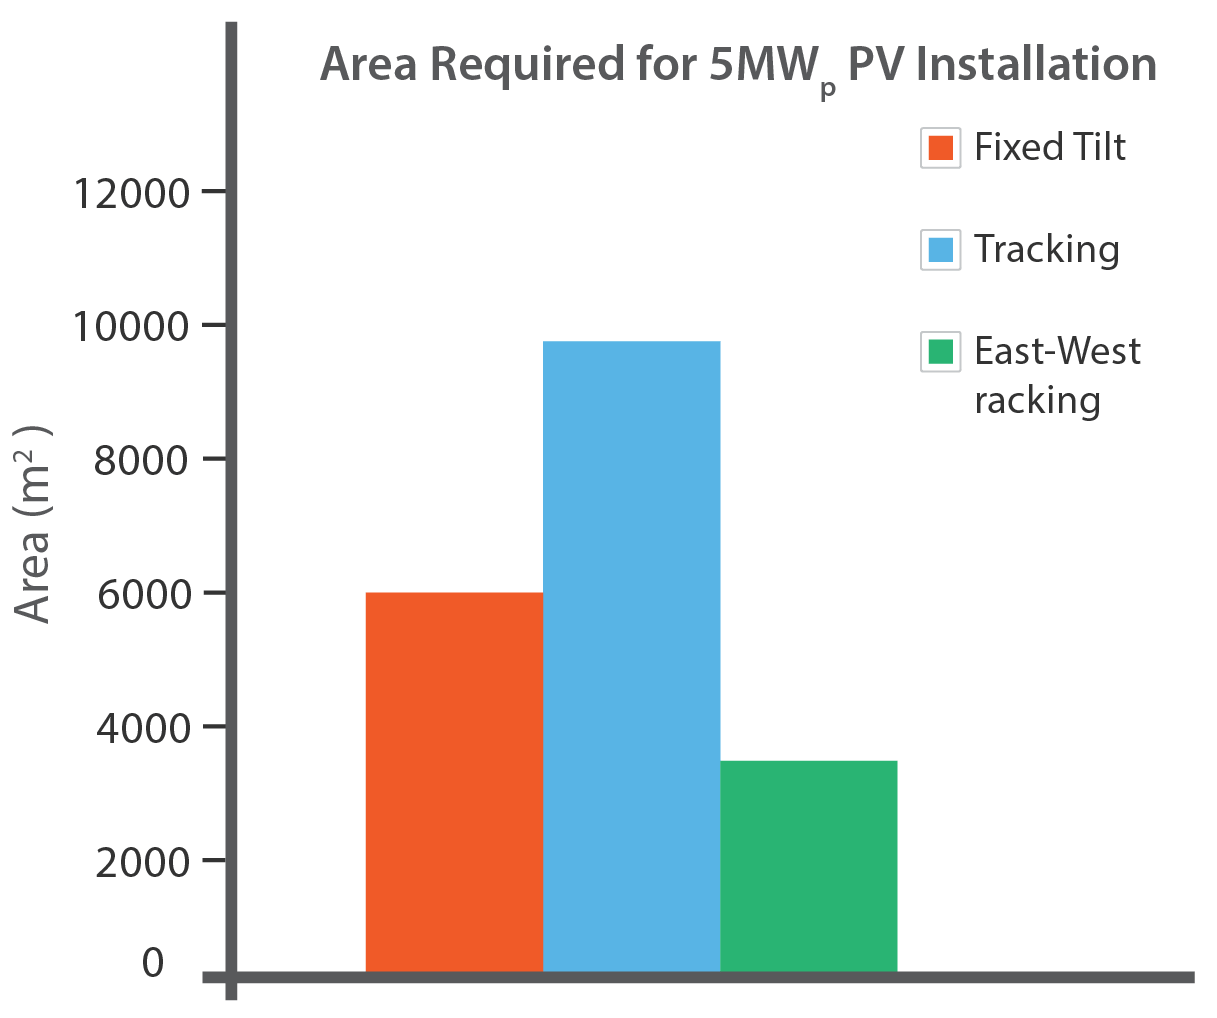
| Area required (m2) | 61,264 | 96,272 | 35,226 |
It can be observed from the table that by keeping the installed capacity of the PV system to 5 megawatts-peak, and removing the area limitation, the results are significantly different. The total energy generated by the tracking solution is higher than any other mounting solutions, which was not the case in scenario 1. In other words, while the tracking solution requires more area, it allows the PV system to generate more energy per installed capacity than the other two mounting solutions. This is due to the higher specific energy production enabled by the tracking solution.
Key figure of comparison results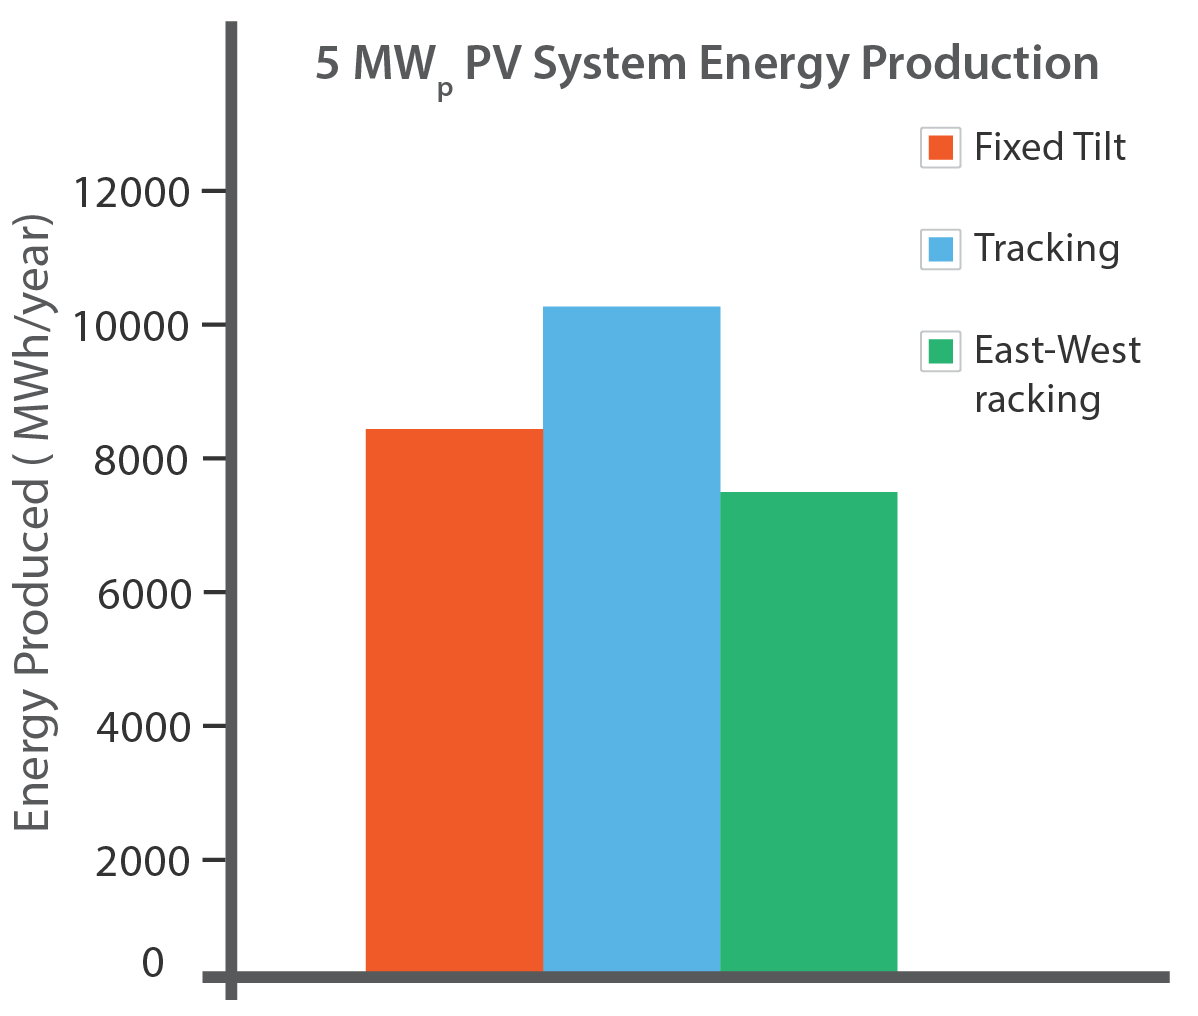
Final Conclusions
The results of this study show that the choice of mounting solution is highly dependent on the constraints of individual projects. When the available area of the site is limited, mounting the array as East-West racking can increase the system energy output. When the site has irregular boundaries, fixed tilt arrays are least affected by this complication. However, when space is not an issue, single axis tracking arrays demonstrates
the best system efficiency.
This study quantified the effects of area on the mounting solutions. However, ultimately the benefits of each of the mounting solution studied needs to be weighed against other project considerations such as cost and availability of the products, system size, local solar resource and preferred generation profile.
GSES provide preliminary and detailed PV system design services. Contact GSES today to start a conversation on how we can help you.